Join Our Telegram channel to stay up to date on breaking news coverage
Bitcoin (BTC) Price Prediction – September 5
BTC/USD is currently in the hands of the sellers but consolidation is likely between $9,500 and $10,500.
BTC/USD Long-term Trend: Bearish (Daily Chart)
Key levels:
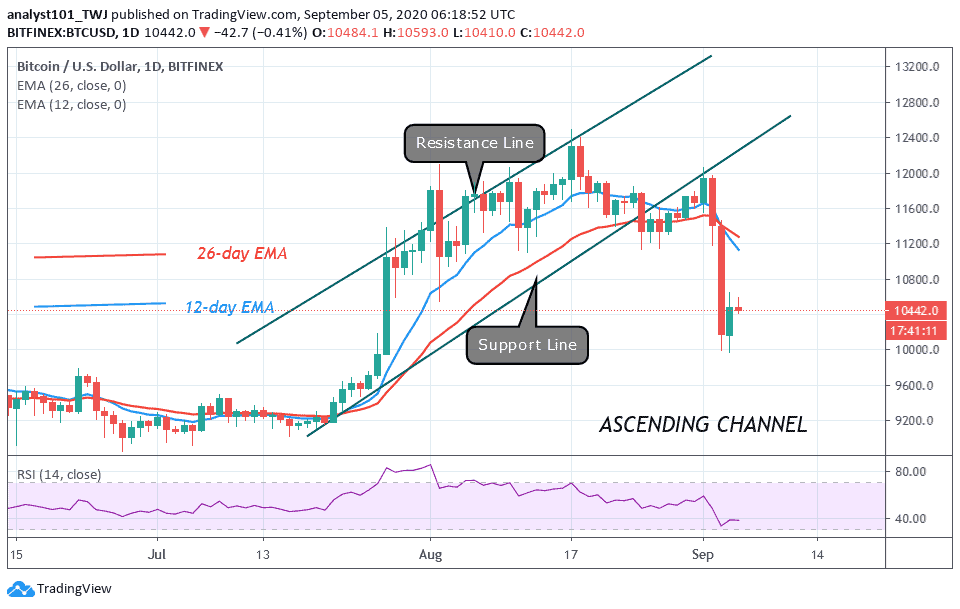
Resistance Levels: $11,000, $11,200, $11,400
Support Levels: $9,200, $9,000, $8,800
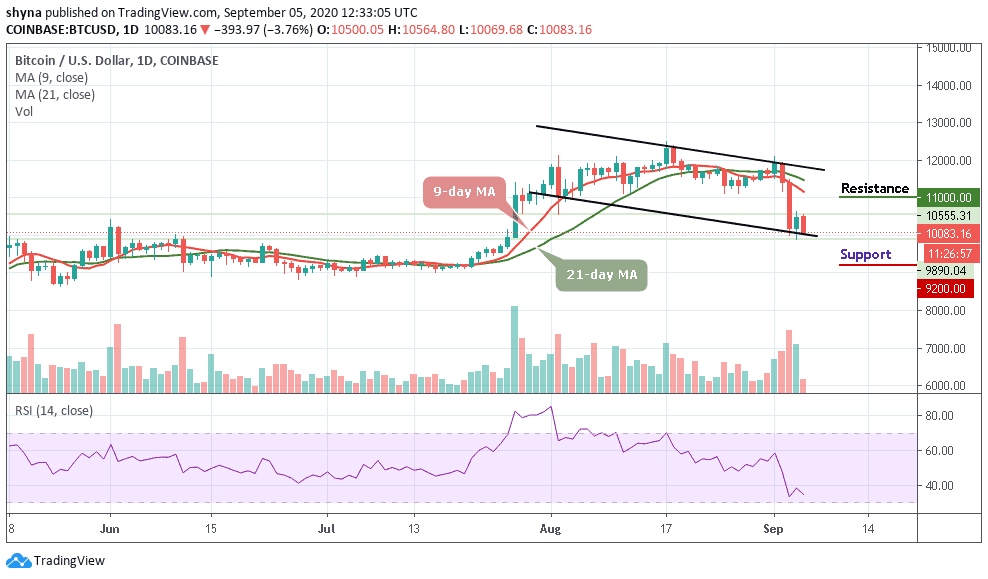
Yesterday, BTC/USD turned heads with its rise to highs above the potential $10,500 level. In fact, the number-one crypto extended its gains above $10,600. More so, the Bitcoin price did not stay up for long because of an immediate reversal. In the early hours of yesterday, BTC/USD held on to the support above $10,000 but today, the tables were turned as BTC/USD is seen trading around $10,083.
What to Expect from Bitcoin (BTC)
At the time of writing, BTC/USD is trading below the moving averages with a loss of 3.76% on the day. The trading is likely to continue the downtrend as the technical indicator RSI (14) moves below 35-level. It is important that the bulls reclaim the position above $10,500 as this would allow them to focus on higher levels towards $11,000. On the other side, continued declines under the short term support at $10,000 could easily open the way to the south.
Meanwhile, breakdown towards $10,000 is not out of the picture because the losses in the last 24 hours show that BTC/USD was not technically ready for the breakout above $10,500. Looking at the daily chart, BTC/USD is yet to make any attempt to regain ground. However, any bullish movement may push the price to the resistance level of $11,000, $11,200, and $11,400 while breaking below the lower boundary of the channel may lead to the support levels at $9,200, $9,000, and $8,800 respectively.
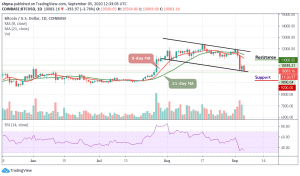
BTC/USD Medium – Term Trend: Bearish (4H Chart)
Looking at the 4-hour chart, Bitcoin’s price is currently trading around $10,002 and below the 9-day and 21-day moving averages after falling from $10,564 where the coin touched today. From a technical point of view, the trend is in the hands of the sellers.

The technical indicator RSI (14) is retreating within the oversold region. As long as the downward trend continues, keeping Bitcoin above $10,500 will be a daunting task. In this case, it is best we look at possible support levels, starting at $9,500, $9,300, and $9,100 while the potential resistance lies at $10,700 and above.
Join Our Telegram channel to stay up to date on breaking news coverage