Join Our Telegram channel to stay up to date on breaking news coverage
The Bitcoin price sees a 1.25% decline today as the cryptocurrency fails to cross above the 9-day moving average.
Bitcoin Prediction Statistics Data:
- Bitcoin price now – $19,988
- Bitcoin market cap – $382.7 billion
- Bitcoin circulating supply – 19.1 million
- Bitcoin total supply – 19.1 million
- Bitcoin Coinmarketcap ranking – #1
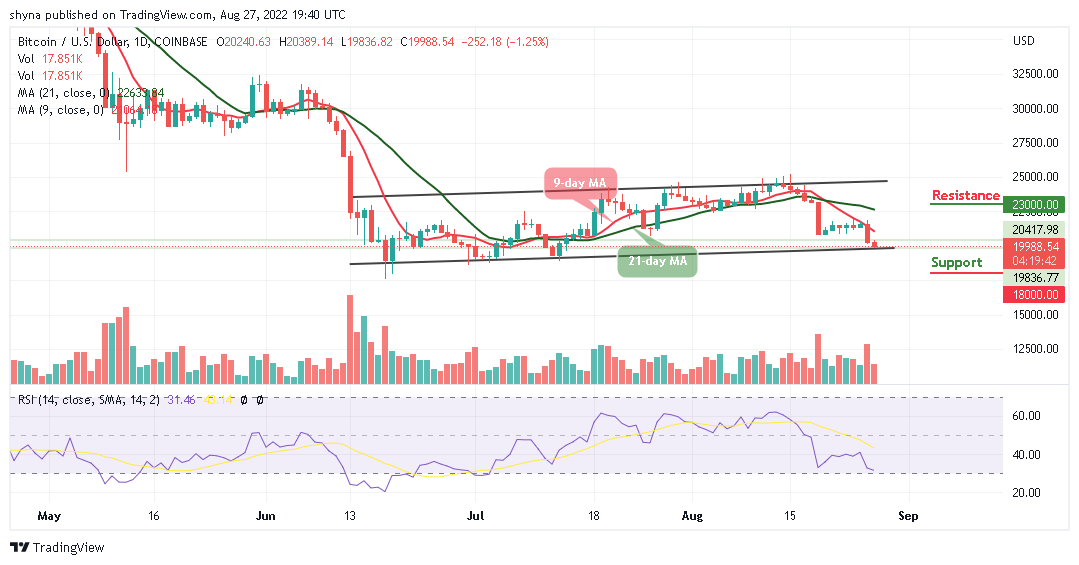
BTC/USD Long-term Trend: Ranging (Daily Chart)
Key levels:
Resistance Levels: $23,000, $24,000, $25,000
Support Levels: $18,000, $17,000, $16,000
Your capital is at risk
BTC/USD loses its momentum after touching key resistance above $20,389. As of writing, the king coin is down 1.25% on the day at $19,988 hovering below the 9-day and 21-day moving averages. Meanwhile, Bitcoin may struggle to close above $20,000 and if it does, it should be free to rise well above this level if it moves in the next positive direction.
Bitcoin (BTC) May Touch $19k; Buy Tamadoge (TAMA) Today
After a slightly positive move above $20,000 during the European session today, the Bitcoin price is sliding below the 9-day and 21-day moving averages. Over the past few days, the king coin has been struggling to break to the upside. Moreover, in today’s session, the coin attempted to push higher but the sellers stepped in and start pushing the coin lower to touch the daily low of $19,836.
Nevertheless, if the coin moves lower, the $19,000 may serve as the nearest support level, which may give room for the coin to fall further to hit the supports at $18,000, $17,000, and $16,000. The Relative Strength Index (14) may dive into the oversold region to confirm the downward movement. On the contrary, if the coin breaks above the moving averages, it may cause the king coin to hit the resistance levels of $23,000, $25,000, and $27,000 which is before the upper boundary of the channel.
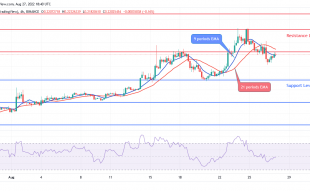
BTC/USD Medium-term Trend: Bearish (4H Chart)
The Bitcoin price is hovering at $20,020 at the time of writing and could take time to cross above the 9-day and 21-day moving averages. However, if the bulls gather enough strength, the upward movement may be able to near the resistance levels of $21,500 and above.
On the downside, immediate support could be located around the $19,500 level while the critical support is at $19,000 and below. Therefore, the Bitcoin price may likely fall towards the lower boundary of the channel if the bears put more pressure on the market, more so, the Relative Strength Index (14) is within the oversold region, suggesting a bearish movement.
Tamadoge has assimilated the lessons learned from other projects. Revenue is generated by fees paid on transactions in the Tamadoge NFT Petstore, where players buy clothes, food, and other necessities and discretionary items for their pets. You can own as many pets as you like, with the individual traits of each Tamadoge pet constituted as an NFT.
Related:
Join Our Telegram channel to stay up to date on breaking news coverage