Join Our Telegram channel to stay up to date on breaking news coverage
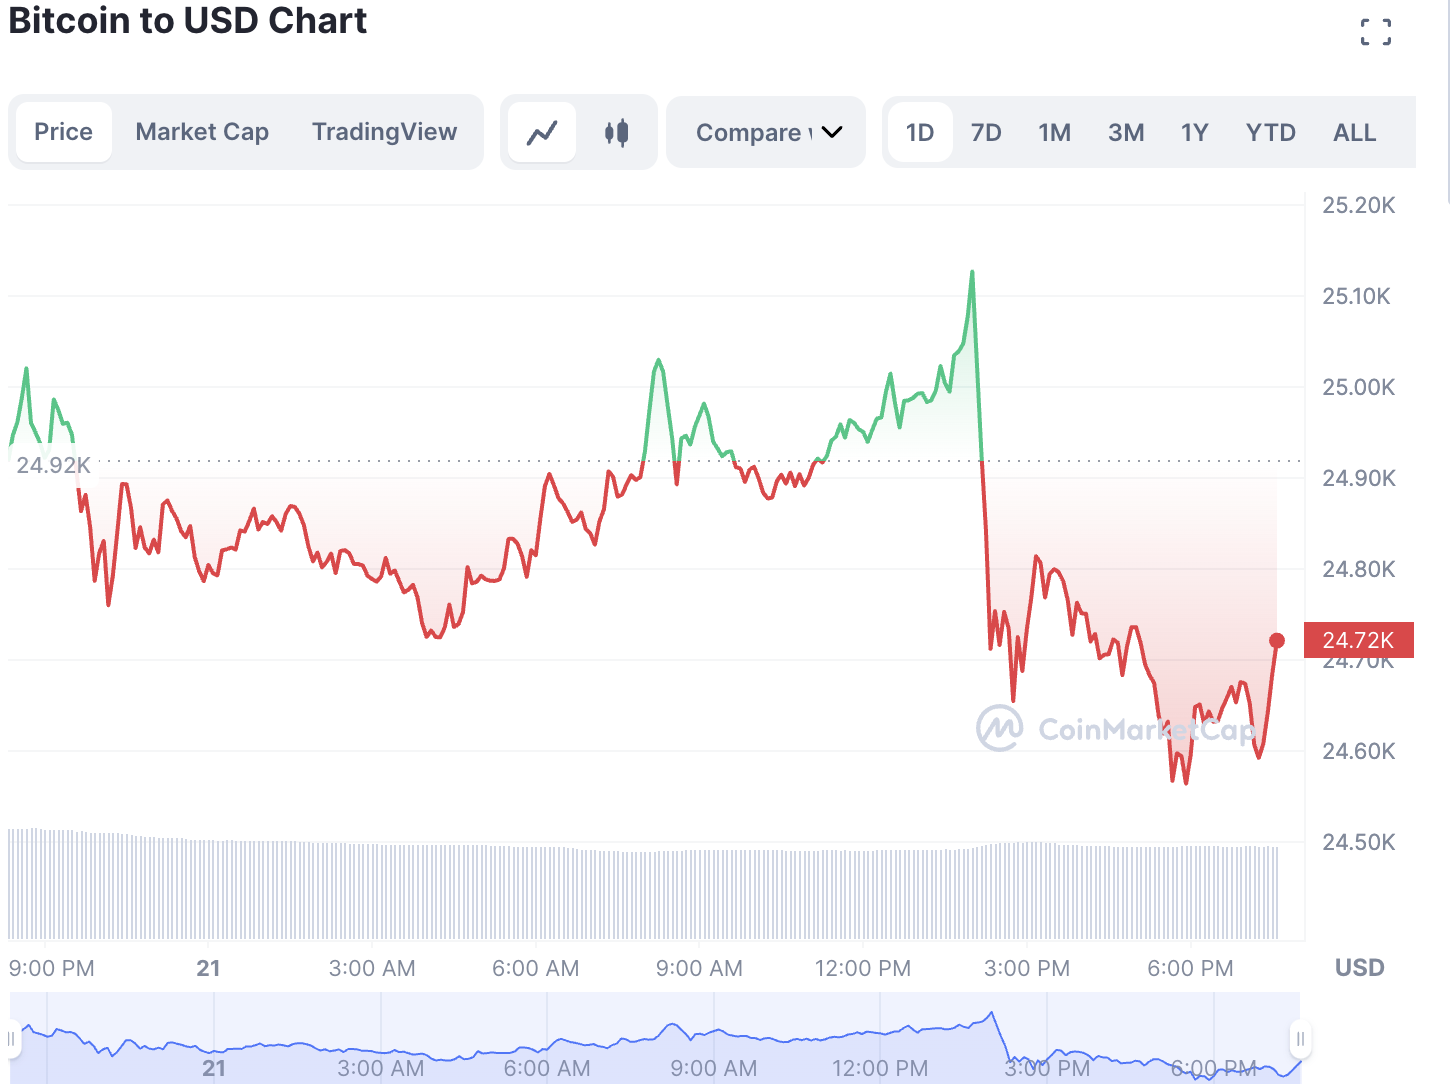
Bitcoin is having a great week, with its price skyrocketing over the $25,000 threshold first time since August. The Bitcoin price has been experiencing a bullish movement for the last few days. Earlier this week, it experienced the highest single daily rise in 3 months.
Investors are keeping a sharp eye on the price movement of Bitcoin this week. The entire cryptocurrency industry is waiting to see if BTC’s price will go further up and close to the $25,400 target.
The world’s largest cryptocurrency- Bitcoin, is extremely volatile in nature. The market fluctuates a lot owing to certain external factors. Although Bitcoin has gained a lot in value since its initial launch, it is not immune to the pitfalls of the cryptocurrency market. To be able to predict its movement accurately, it is crucial to look at Bitcoin’s past price graphs and behavior patterns.
Bitcoin’s Performance in The Last Week
The last week has been bullish for Bitcoin. Its price has been increasing and slowing moving above $24,000, and now has reached close to $24,500. In the last week, BTC’s price has been in the range of $21,800 to $25,000.
Today, the price of one Bitcoin is around $24,723. This means BTC has witnessed a rise of around 12% in the last seven days. In the last 24 hours, the price of one Bitcoin has gone down by 0.8% approx.
Bitcoin is the largest cryptocurrency by its market capitalization, which is currently at around 476 billion. BTC’s 24-hour trading volume is at around 28.8 billion, with a dip of about 8.2%. BTC’s current circulating supply has reached 92% of its maximum supply. Today, its circulating supply stands at approx 19.3 million.
Signs From Bitcoin’s SMA and RSI
A close-up study of a cryptocurrency’s simple moving averages and relative strength index is important. These two widely used analytical tools are often an indication of how a cryptocurrency is currently performing. SMA and RSI could also offer valuable insights into a token’s future price movements.
Bitcoin’s 50-day SMA today is around $21,300. Whereas, Bitcoin’s 200-day SMA is around $19,730. As predicted previously, Bitcoin has already reached the “golden cross” with its short-term SMA crossing above its long-term SMA. A “golden cross” indicates a strong bullish movement in the cryptocurrency market. This essentially means that Bitcoin’s price could surge further up.
BTC’s current price is around $24,723 today. BTC’s current price is about 20.2% above its 200-day SMA. Similarly, BTC’s current price of around $24,723 is around 15.7% above its 50-day SMA. This again establishes the possible occurrence of a bullish movement in the Bitcoin market.
The RSI score of a cryptocurrency offers critical information regarding its bought and sold status. The current RSI score of Bitcoin is almost 66 which indicates a neutral position. With an investment point of view, it is better to wait for the prices to fall to buy it.
Bitcoin’s Performance in the Last Few Months
After reviewing Bitcoin’s performance last week, now it is time to look back at its past performances. Price trends and fluctuation patterns offer further information on its future price curve.
Bitcoin’s price graphs over the last 3 months indicate a clear upward trend in its price. From November 2022 until the beginning of this year, BTC’s price per token was well below the $18,200 mark.
Its price began to rise steadily from the 12th of January, 2023. In just about two weeks, from 12th to 30th January, its price had increased from around $18,720 to almost $23,745. This 21.2% jump in its price was crucial for its current momentum.
In just 3 months, Bitcoin’s price has jumped by about 20%. This could potentially mean that in the future, Bitcoin’s price is projected to increase further.
However, if a one-year price trend of BTC is considered, the picture does not look so positive. Over the last year, the price of one BTC token has dropped from around $37,000 to its current around $24,700. This means a drop of around 33%.
Experts believe that BTC currently has a good run. However, it is too soon to say whether or not it will catch up with its last year’s value of $37,000.
Is Bitcoin Creeping Closer To $25,400?
Let’s move on to Bitcoin’s current support and resistance levels. These two important market tools are widely used by many experts to study a currency’s price graph.
Today, Bitcoin’s resistance levels are at $25,256, $25729, and $26,400. At the same time, its support levels are at $24,120, $23,445, and $22,978. The current price is below its resistance level, which means that there is still room for the price to increase and reach the maximum resistance level of $26,400. This could essentially mean that in the coming days, Bitcoin’s price may touch $25,400.
Bitcoin’s current price is way above its support levels, which means that currently, there is less demand for the token, and potential buyers should wait for its price to break the resistance level and reverse its standing.
If Bitcoin’s weekly candle closing is above $25,729, then its price has the potential to go further up. If, however, the weekly candle closing fails to surpass $25,729, then the price may drop down to $22,000.
Concise Summation on Bitcoin
The cryptocurrency industry behaves in a mercurial way. It is affected and influenced by many external factors, such as social media frenzy, celebrity involvement, public sentiments, and the US economy. Thus, no one can accurately predict what is going to happen in the future and how it will affect a digital asset’s price.
After the uncertainties and losses of the market in 2022, the future of cryptocurrency will now be under the scrutiny of the US Securities and Exchange Commission. Regulations and investigations around cryptocurrency have previously been controversial and detrimental to this market. Thus, this regulation could affect the price of Bitcoin in the future.
However, for now, Bitcoin is moving in a bullish movement. The current “golden cross” could continue for a few days, thus ensuring that Bitcoin’s price may still rise.
The question of whether or not Bitcoin is a safe investment is subjective. The answer depends on an investor’s personal preference, risk-taking ability, and affordability. It is strongly suggested that one should do thorough research on the cryptocurrency market, historical trends, and current affairs.
Related Articles
Best Wallet - Diversify Your Crypto Portfolio
- Easy to Use, Feature-Driven Crypto Wallet
- Get Early Access to Upcoming Token ICOs
- Multi-Chain, Multi-Wallet, Non-Custodial
- Now On App Store, Google Play
- Stake To Earn Native Token $BEST
- 250,000+ Monthly Active Users
Join Our Telegram channel to stay up to date on breaking news coverage


