Join Our Telegram channel to stay up to date on breaking news coverage
Bitcoin (BTC) Price Prediction – August 15
Bitcoin (BTC) is currently consolidating beneath $12,000 after facing a slight rejection at this level in the early trading session of today.
BTC/USD Long-term Trend: Bullish (Daily Chart)
Key levels:
Resistance Levels: $12,900, $13,100, $13,300
Support Levels: $10,800, $10,6 00, $10,400

BTC/USD is seen fluctuating in a tight range a little below $12,000 at the time of writing, although the coin came under modest bearish pressure and dropped to a daily low of $11,690. Nevertheless, bulls easily retake the control of the price action and now gaining 1.26% on a daily basis at $11,927. Nevertheless, a decisive move above the critical $12,000 may likely come into focus in the next few hours.
Will Bitcoin (BTC) Now Break Above $12,000 or Reverse?
BTC/USD has been repeatedly rejected from $12,000 level but the bulls are relentless and not letting go of any opportunity to breach this higher resistance to push the prices higher. Moreover, the technical indicator RSI (14) is seen facing upwards with a decent room above to make some bullish movement. However, as long as the coin remains above the 9-day and 21-day moving averages, the long-expected resistance level of $12,500 may come into play.
Furthermore, as the bulls continue to control the market, any further bullish movement may likely push the coin to reach the important resistance levels of $12,900, $13,100, and $13,300 respectively while the supports lie at $10,800, $10600, and $10,400 if the market price drops below the moving averages.
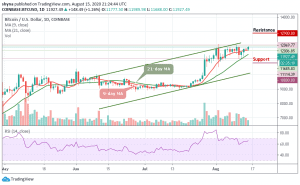
BTC/USD Medium – Term Trend: Ranging (4H Chart)
According to the 4-hour chart, BTC/USD is hovering at $11,927 above the 9-day and 21-day moving averages after a reversal from $12,002 after touching the daily low of $11,740. Meanwhile, at the moment, the bullish supply is coming up slowly in the market as the RSI (14) faces the overbought region.

However, if the buyers could power the market more, they can further push the price above the upper boundary of the channel which could allow the coin to touch the resistance level of $12,300 and above. On the contrary, if the coin drops below the moving averages, it may hit the nearest supports at $11,500 and below.
Join Our Telegram channel to stay up to date on breaking news coverage