Join Our Telegram channel to stay up to date on breaking news coverage
The Bitcoin price prediction shows that BTC is now moving above the $19,000 level as the crypto prepares for a new trend.
Bitcoin Prediction Statistics Data:
- Bitcoin price now – $19,178
- Bitcoin market cap – $368 billion
- Bitcoin circulating supply – 19.1 million
- Bitcoin total supply – 19.1 million
- Bitcoin Coinmarketcap ranking – #1
BTC/USD Long-term Trend: Ranging (Daily Chart)
Key levels:
Resistance Levels: $22,000, $23,000, $24,000
Support Levels: $17,000, $16,000, $15,000
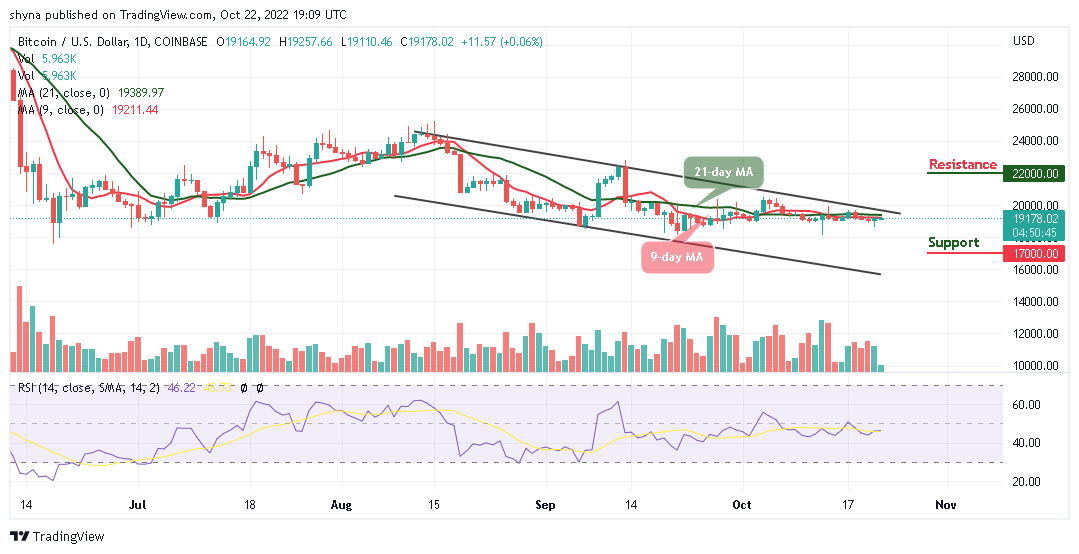
BTC/USD is slightly in the green after adjusting from the short-term support at $19,110. At the time of writing, the first digital asset is currently moving towards the 9-day and 21-day moving averages but the buyers have their eyes on the first key hurdle at $20,000 as the coin begins to create a new trend.
Bitcoin Price Prediction: Can BTC Price Retest $20,000 Resistance?
Looking at the daily chart, can traders say Bitcoin price is back in the hands of the bulls? The technical indicator Relative Strength Index (14) is seen moving above the 40-level, if the indicator can begin with an upward trend, the price could also be pushed towards the resistance level of $21,000. On the other hand, the gap between the 9-day moving average and the 21-day moving average suggests that the upward movement may still come into play.
Nevertheless, BTC/USD could also settle in a tight range limited by $19,000 on the downside and $20,000 on the upside. Therefore, if the market price breaks above the upper boundary of the channel, BTC/USD could hit the potential resistance levels at $22,000, $23,000, and $24,000 while the supports are located towards the lower boundary of the channel at $17,000, $16,000, and $15,000 respectively.
BTC/USD Medium-term Trend: Bearish (4H Chart)
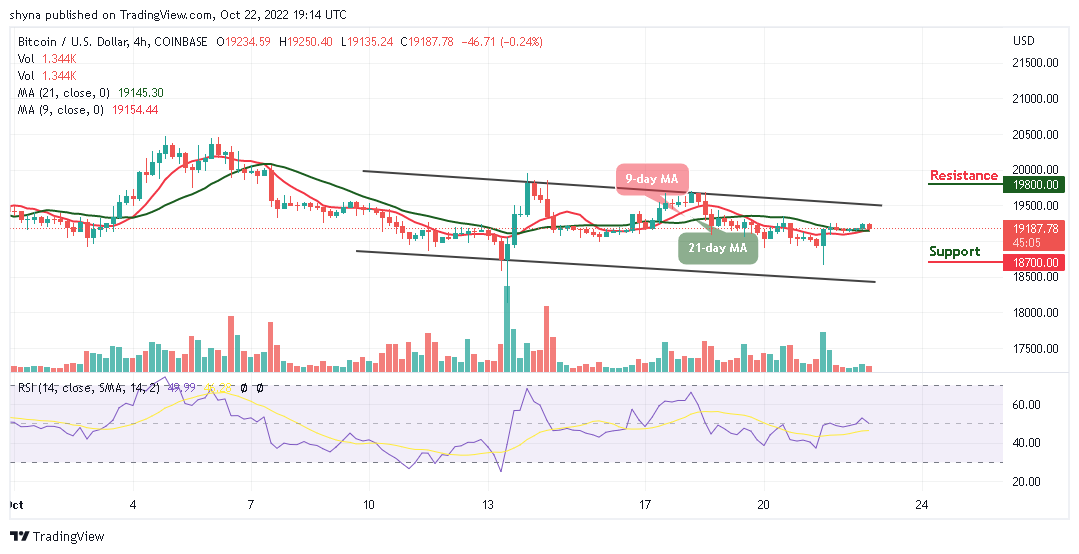
The 4-hour chart reveals that BTC/USD is trading above the 9-day and 21-day moving averages. However, the coin may depreciate if the $19,000 support is broken one more time. This may likely cause the Bitcoin price to fall towards the lower boundary of the channel which may bring it to the critical support level of $18,700 and below.

On the contrary, if the bulls regroup and hold the current price tight, BTC/USD may likely cross above the upper boundary of the channel to hit the potential resistance level at $19,800 and above as the technical indicator Relative Strength Index (14) remains above the 50-level, which may likely give additional bullish signals.
Related:
Join Our Telegram channel to stay up to date on breaking news coverage


