
Join Our Telegram channel to stay up to date on breaking news coverage
The Bitcoin price prediction shows that BTC is currently down by 0.22% after terribly crossing into the negative side.
Bitcoin Prediction Statistics Data:
- Bitcoin price now – $19,000
- Bitcoin market cap – $364.3 billion
- Bitcoin circulating supply – 19.1 million
- Bitcoin total supply – 19.1 million
- Bitcoin Coinmarketcap ranking – #1
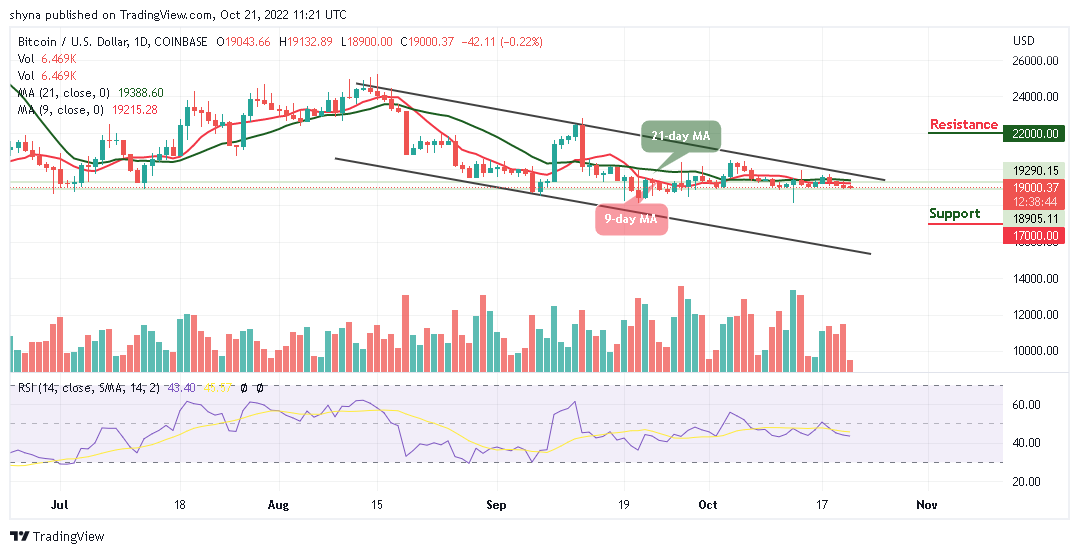
BTC/USD Long-term Trend: Ranging (Daily Chart)
Key levels:
Resistance Levels: $22,000, $23,000, $24,000
Support Levels: $17,000, $16,000, $15,000
The daily chart reveals that BTC/USD finally trades below the $19,000 support level to touch the new daily low at $18,900. If the bears increase the selling pressure, the Bitcoin price may see another sharp drop below the support level of $18,500. However, the technical indicator Relative Strength Index (14) is likely to cross below the 40-level.
Bitcoin Price Prediction: Bitcoin (BTC) Ready to Fall More
According to the daily chart, the Bitcoin price refuses to move to the positive side as the coin prepares for another few days of negative movement if it heads toward the channel’s lower boundary. Moreover, the first support level could be located at around $18,000. Beneath this, other support lies at $17,000, $16,000, and $15,000 levels. Meanwhile, a break above the upper boundary of the channel could set Bitcoin up to test the resistance level of $20,000.
The Bitcoin price may likely face the downside as the 9-day MA remains below the 21-day MA. With this, traders can see that the cost of Bitcoin is ready to drop more. On the contrary, if the coin moves toward the upside, the king coin could locate the potential resistance levels at $22,000, $23,000, and $24,000 if crosses above the upper boundary of the channel.
BTC/USD Medium-term Trend: Bearish (4H Chart)
The 4-hour chart shows that the Bitcoin bears are now back fully into the market pushing the BTC price below the support level of $19,000. Although the Bitcoin price is still hovering around this level, it is in the loop of making a bounce back.
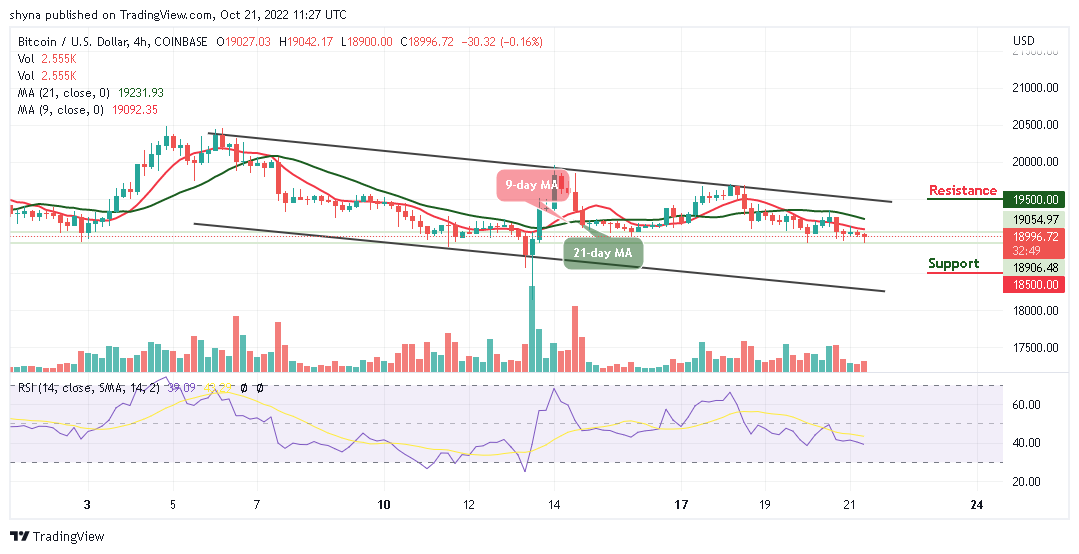
Looking at the chart, any possible bullish movement may push the price to the nearest resistance level of $19,500 and above. On the other hand, any further bearish movement toward the channel may locate support at $18,500 and below. The technical indicator Relative Strength Index (14) moves to cross below the 40-level, suggesting bearish signals.
Currently, the IMPT token is more than midway through its presale and has thus far experienced dramatic success, having now raised around $6m.
Dash 2 trade is crypto analytics and intelligence platform that provides users with valuable insights to make informed investment decisions when trading crypto. The first platform of its kind, Dash 2 Trade calls itself a “Bloomberg Terminal of Crypto”, offering complete pro-level features to ordinary traders so they can get the most out of the volatility of the crypto space.
Related:
- How to buy D2T token
Join Our Telegram channel to stay up to date on breaking news coverage