Join Our Telegram channel to stay up to date on breaking news coverage
As the daily chart reveals, the Bitcoin price prediction is showing positive signs and it is likely to accelerate higher in the near term.
Bitcoin Prediction Statistics Data:
- Bitcoin price now – $19,196
- Bitcoin market cap – $368.5 billion
- Bitcoin circulating supply – 19.1 million
- Bitcoin total supply – 19.1 million
- Bitcoin Coinmarketcap ranking – #1
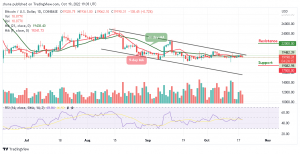
BTC/USD Long-term Trend: Ranging (Daily Chart)
Key levels:
Resistance Levels: $22,000, $23,000, $24,000
Support Levels: $17,000, $16,000, $15,000
BTC/USD may have been stuck in a narrow range between $18,500 and $19,500 as the attempts to hit highs above $20,000 is yet to come into focus. At the time of writing, the Bitcoin price is hovering at $19,196 while facing a bearish building momentum. The Bitcoin price is currently consolidating with a few bearish signals. However, the recent correction to the upward fails near the $19,300 resistance level.
Bitcoin Price Prediction: What is the Next Direction for Bitcoin?
If the Bitcoin price fails to climb above the 9-day and 21-day moving averages, there could be more downside corrections. Meanwhile, the $19,000 level may continue to be a decent support zone while the next major support is near the $18,000 level. Any further losses might call for a drop toward the $17,000, $16,000, and $15,000 support levels.
However, if there is a clear break to the upside, the Bitcoin price could test the nearest resistance level at $20,000. If the bulls manage to gain strength above this level, there are chances of a decent recovery above the upper boundary of the channel as the key breakout zone is near the potential resistance levels at $22,000, $23,000, and $24,000 respectively. But the technical indicator Relative Strength Index (14) is seen moving below the 50-level, suggesting a sideways move into the market.
BTC/USD Medium-term Trend: Ranging (4H Chart)
The 4-hour chart shows that the Bitcoin price is trying to cross above the 9-day and 21-day moving averages. This pattern is considered bullish because it forms after a slight rise in price followed by a minor recovery. Should the price remain below the moving averages; it could reach the nearest support at $18,500 and below.
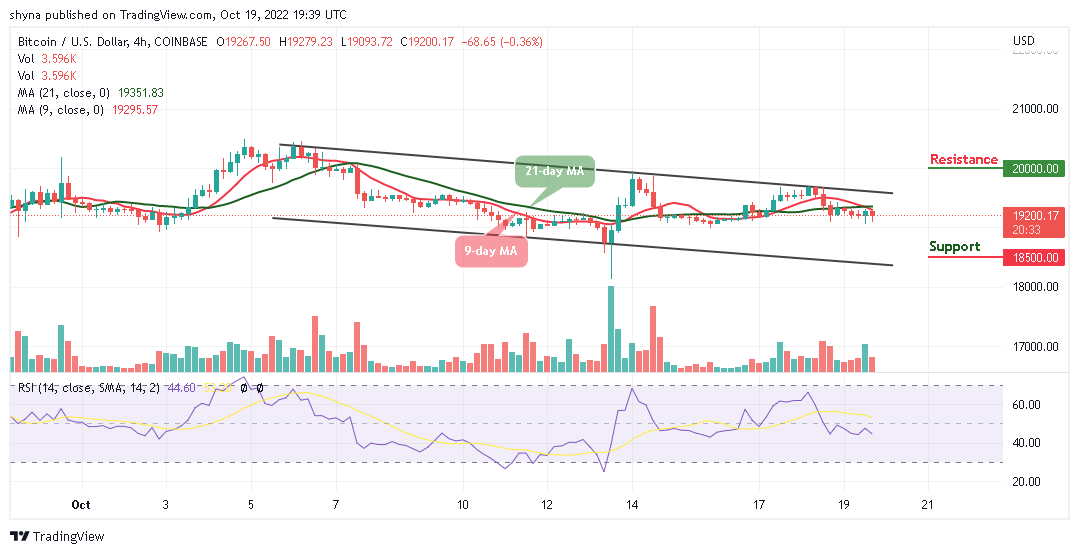
However, if the bulls push the coin above the upper boundary of the channel, it could hit the potential resistance level of $20,000, and above. At the moment, the market is likely to follow the bullish movement as the Relative Strength Index (14) moves to cross above the 60-level.
Related:
- How to Buy IMPT Token
Join Our Telegram channel to stay up to date on breaking news coverage