Join Our Telegram channel to stay up to date on breaking news coverage
The Bitcoin price prediction restarts the uptrend after crossing above the critical barrier of $21,000 to touch the daily high of $21,298.
Bitcoin Prediction Statistics Data:
- Bitcoin price now – $21,265
- Bitcoin market cap – $399.8 billion
- Bitcoin circulating supply – 19.1 million
- Bitcoin total supply – 19.1 million
- Bitcoin Coinmarketcap ranking – #1
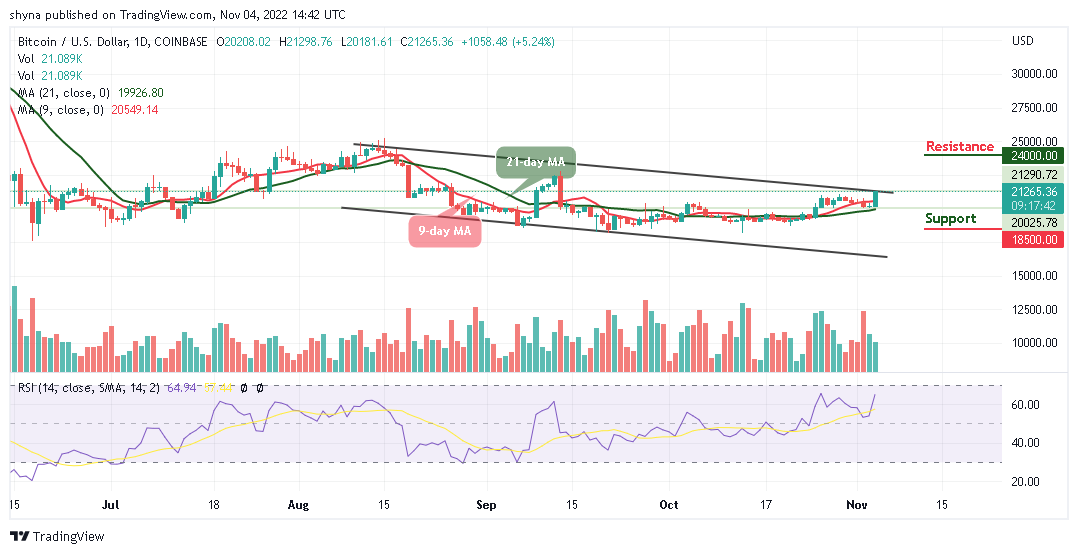
BTC/USD Long-term Trend: Ranging (Daily Chart)
Key levels:
Resistance Levels: $24,000, $25,000, $26,000
Support Levels: $18,500, $17,500, $16,500
BTC/USD looks green today as the price hovers above the resistance level of $21,000 from the low of $20,181.61. However, a daily close above the $22,000 level can continue to increase the Bitcoin price to $23,000. At the moment, all eyes focus on the next hurdle above the upper boundary of the channel as a consistent price increase may encourage more buyers to join the market if bulls increase their positions.
Bitcoin Price Prediction: BTC May Jump to the Upside
At the time of writing, the Bitcoin price is moving slightly at its current price of $21,265 with two straight bullish days. According to the daily chart, this marks a meaningful climb from the opening price of $20,208 level; therefore, it is important to note that the current price movement may break above the upper boundary of the channel.
Nevertheless, if the market decides to fall below the 9-day and 21-day moving averages, the Bitcoin price could go towards the lower boundary of the channel, and before getting to this barrier, traders could have hit the support levels at $18,500, $17,500, and $16,500 respectively. All the same, any further bullish movement may push the coin to the resistance level of $24,000, $25,000, and $26,000 as the Relative Strength Index (14) moves to cross above 70-level, suggesting more bullish signals.
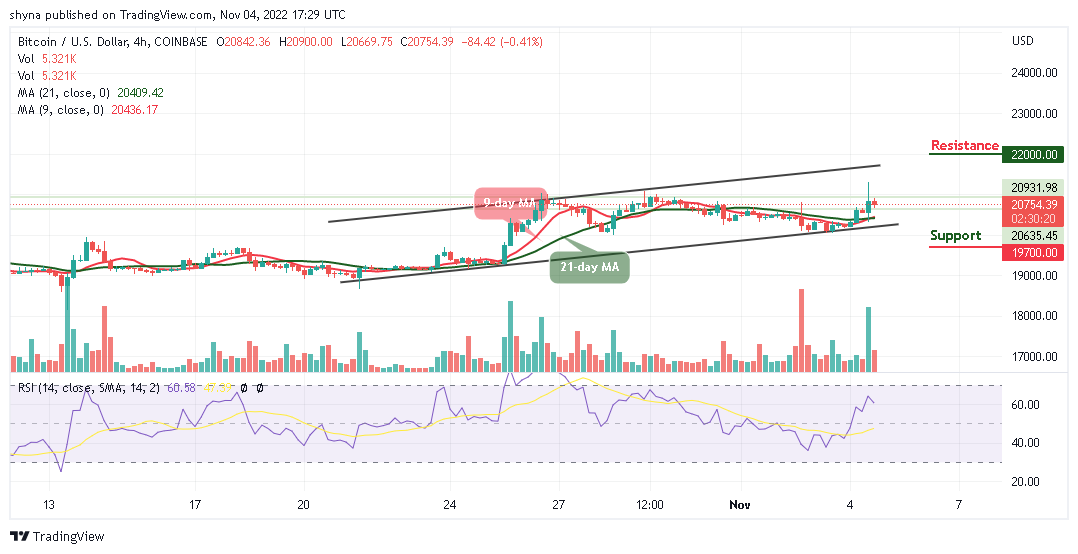
BTC/USD Medium-term Trend: Ranging (4H Chart)
According to the 4-hour chart, the Bitcoin price is hovering above the 9-day and 21-day moving averages as the intraday trading looks bullish facing the upper boundary of the channel to hit the resistance level of $22,000 and above.

However, if the buyers failed to keep pushing the market upward, traders can expect a retreat below the support level of $20,000, and breaking this level may further bring the price below the lower boundary of the channel to reach the support level of $19,700 and below. Meanwhile, the Relative Strength Index (14) is likely to cross below the 60-level, suggesting bearish signals.
IMPT Getting More Popular
The IMPT presale raises over $12 million. The IMPT revolutionizes the concept of carbon credit. This is the perfect time to join the presale and enter the ground floor, as an IMPT token cost around $0.023.
Dash 2 Trade (D2T) Presale Getting Hotter
Dash 2 Trade raises over $4 million in its presale and reveals that LBANK Exchange will be the first CEX to sell its D2T token. The company hit that benchmark in recent weeks after launching its public token sale.
Related:
Join Our Telegram channel to stay up to date on breaking news coverage


