Join Our Telegram channel to stay up to date on breaking news coverage
The Bitcoin price prediction shows that BTC is having a bullish day as the king coin moves to cross above the moving averages.
Bitcoin Prediction Statistics Data:
- Bitcoin price now – $16,480
- Bitcoin market cap – $316.49 billion
- Bitcoin circulating supply – 19.2 million
- Bitcoin total supply – 19.2 million
- Bitcoin Coinmarketcap ranking – #1
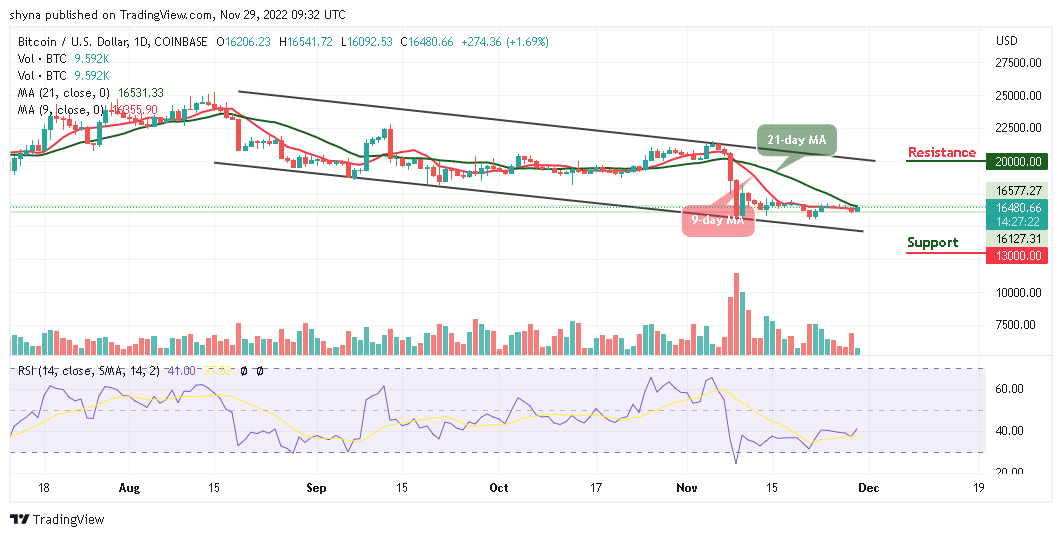
BTC/USD Long-term Trend: Bearish (Daily Chart)
Key levels:
Resistance Levels: $20,000, $22,000, $24,000
Support Levels: $13,000, $11,000, $9,000
BTC/USD bulls are trying to push the coin above the resistance level of $16,500 as the pair could start a decent increase if it clears the $16,500 resistance zone. However, the Bitcoin price could move with strong bullish momentum after a sustainable break above an important resistance level.
Bitcoin Price Prediction: Bitcoin (BTC) Would Move to the Upside
According to the daily chart, the technical indicator Relative Strength Index (14) is crossing above the 40-level as the bulls appear to push the Bitcoin price toward the upper boundary of the channel. Moreover, the Bitcoin price seems to be struggling around the 9-day and 21-day moving averages, suggesting that BTC/USD could retreat a little bit, before attempting to break higher again.
On the upside, the Bitcoin price is forming a base and might soon rise above the $16,500 resistance zone. A daily close above this could lift the price to the resistance levels of $20,000, $22,000, and $24,000. On the contrary, Bitcoin could retreat and move towards the lower boundary of the channel as the king coin is changing hands at $16,480. However, if it slides and remains below the 9-day moving average, the critical supports could be found at $13,000, $11,000, and $9,000 respectively.
BTC/USD Medium-term Trend: Ranging (4H Chart)
According to the 4-hour chart, BTC/USD is currently trading above the 9-day and 21-day moving averages as crossing above the upper boundary of the channel could hit the resistance level of $17,500 and above. But the Bitcoin market is likely to continue moving sideways if it moves in the same direction.
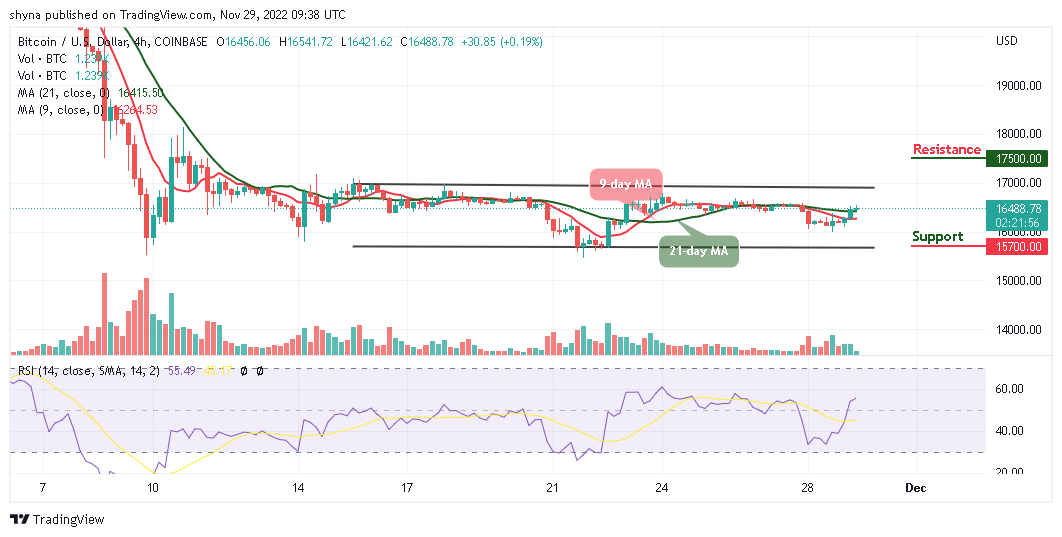
The Relative Strength Index (14) shows that the BTC price may cross into the upside as the signal line moves to cross above the 60-level. On the contrary, if the coin slide below the 9-day and 21-day moving averages; the support level of $15,700 and below may be located.
Whereas, the IMPT presale is still live on their official website, and it has raised almost $13.5 million. This project makes everybody partake and assist the planet in a cool and efficient manner. Do not miss this attractive offer. You can also join their Discord channel.
However, the FTX disaster shows that there is a need for a cutting-edge, innovative platform that can detect disasters that are similar to FTX/FTT, and enable speculators to pinpoint secure trading signals for massive returns. The platform is Dash 2 Trade (D2T), whose presale is currently ongoing. The presale has realized about $7.5 million. The D2T affiliate program is also open to all. You can earn your share of the revenue by using the Dash 2 Trade referral links!
Related
- D2T Price Prediction
- How to Buy D2T
Join Our Telegram channel to stay up to date on breaking news coverage