Join Our Telegram channel to stay up to date on breaking news coverage
The Bitcoin price prediction reveals that BTC is yet to gain strength above the 21-day moving average as the coin ranges.
Bitcoin Prediction Statistics Data:
- Bitcoin price now – $20,000
- Bitcoin market cap – $316.9 billion
- Bitcoin circulating supply – 19.2 million
- Bitcoin total supply – 19.2 million
- Bitcoin Coinmarketcap ranking – #1
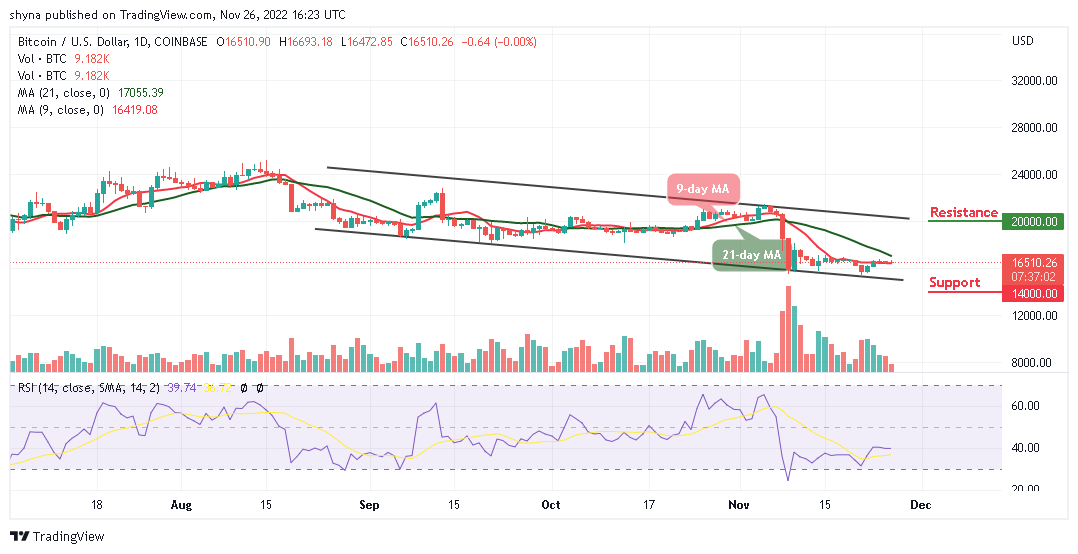
BTC/USD Long-term Trend: Bearish (Daily Chart)
Key levels:
Resistance Levels: $20,000, $22,000, $24,000
Support Levels: $14,000, $12,000, $10,000
After another failure to hit the resistance level of $20,000; BTC/USD remains under the 21-day moving average. Meanwhile, the Bitcoin price could begin another decline if bulls failed to push the coin to the upside. At the opening of today’s trading; the king coin touches the resistance level of $16,693, but any further bearish movement may bring the coin down to the bearish zone.
Bitcoin Price Prediction: Bitcoin (BTC) May Head to the South
As the Bitcoin price hovers within the moving averages, heading toward the lower boundary of the channel may increase the selling pressure. Therefore, if there are more losses, the price could break the major supports at $14,000, $12,000, and $10,000. Meanwhile, the technical indicator Relative Strength Index (14) moves in the same direction around the 40-level, suggesting sideways movement.
On the other hand, if the king coin crosses above the 21-day moving average; it could head towards the upper boundary of the channel and a clear break above this barrier may cause the coin to the resistance levels of $20,000, $22,000, and $24,000.
BTC/USD Medium-term Trend: Ranging (4H Chart)
According to the 4-hour chart, the coin may gain lost momentum if the coin moves to cross above the upper boundary of the channel. At the moment, the volatility still hovers, and the selling pressure still exists as this could lead the coin to the downside. Meanwhile, the $15,500 and below may come into play if BTC breaks toward the lower boundary of the channel.
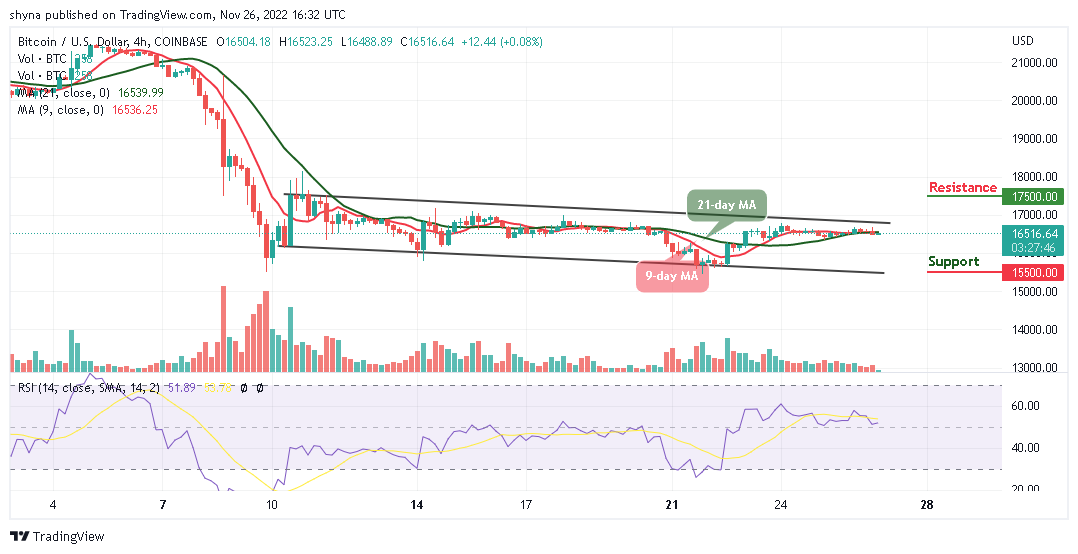
Meanwhile, if the buyers can reinforce and power the market, traders can expect a bullish cross above the upper boundary of the channel, and breaking this barrier may allow the bulls to reach the resistance level of $17,500 and above. The Relative Strength Index (14) is moving above the 50-level, which shows that the market could follow the bullish movement.
Whereas, the IMPT presale is still live on their official website, and it has raised almost $13.5 million. This project makes everybody partake and assist the planet in a cool and efficient manner. Do not miss this attractive offer. You can also join their Discord channel.
However, the FTX disaster shows that there is a need for a cutting-edge, innovative platform that can detect disasters that are similar to FTX/FTT, and enable speculators to pinpoint secure trading signals for massive returns. The platform is Dash 2 Trade (D2T), whose presale is currently ongoing. The presale has realized about $7.5 million. The D2T affiliate program is also open to all. You can earn your share of the revenue by using the Dash 2 Trade referral links!
Related
- D2T Price Prediction
- How to Buy D2T
Join Our Telegram channel to stay up to date on breaking news coverage