Join Our Telegram channel to stay up to date on breaking news coverage
The Bitcoin price prediction shows that BTC may be on another bearish run to touch the support level of $15,000.
Bitcoin Prediction Statistics Data:
- Bitcoin price now – $15,956
- Bitcoin market cap – $301.6 billion
- Bitcoin circulating supply – 19.2 million
- Bitcoin total supply – 19.2 million
- Bitcoin Coinmarketcap ranking – #1
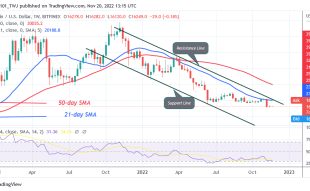
BTC/USD Long-term Trend: Bearish (Daily Chart)
Key levels:
Resistance Levels: $19,000, $20,000, $21,000
Support Levels: $14,000, $13,000, $12,000
In the early hours of today, BTC/USD bounced back above $16,000 after sliding below this level a few days ago. As the trend continues above $16,000, it starts to look like the king coin is finally on a recovery path, but it is not. Meanwhile, the recovery only shows a temporary stoppage of the ongoing bleeding as the momentum continues to fall across the market.
Bitcoin Price Prediction: Can Bitcoin Price Touch $15k Low?
According to the daily chart, the Bitcoin price may touch the low of $15,000 in the next negative movement. Meanwhile, if the price slump to the downside, the $15,000 mark could be a critical zone to keep an eye on as crossing below the lower boundary of the channel could take the price to the supports at $14,000, $13,000, and $12,000, making room for BTC to fall even further.
Additionally, the technical indicator Relative Strength Index (14) for the signal line nosedives below the 50-level as trading volume confirms the bearish movement. Therefore, if the king coin decides to move the price above the 9-day and 21-day moving averages; Bitcoin price may see resistance levels at $19,000, $20,000, and $21,000.
BTC/USD Medium-term Trend: Ranging (4H Chart)
According to the 4-hour chart, the Bitcoin price remains below the 9-day and 21-day moving averages to touch the low of $15,888. After this sudden fall, the coin started picking again to where it’s trading currently at $15,974. Therefore, should the market price drop below the lower boundary of the channel; it could reach the nearest support at $14,000 and below.
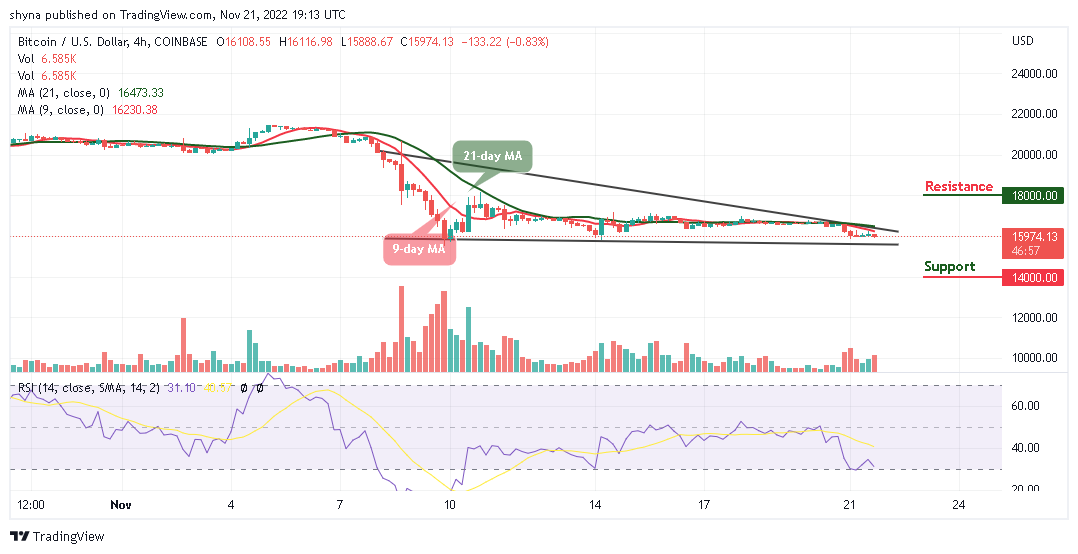
Moreover, if the bulls push the coin above the channel, BTC/USD could hit the resistance at $17,000 before heading to the previous resistance level of $18,000 and above. Meanwhile, the market is likely to follow a bearish trend as the technical indicator Relative Strength Index (14) moves to cross into the oversold region.
In addition, the Bitcoin price may be facing the downside, but traders should note that the IMPT token presale is still live, and close to $13.5 million has been realized so far. In addition, the IMPT team has announced a giveaway promo of $100K IMPT. This is not something you may want to miss.
On the same note, D2T token presale is also ongoing, and a novel platform like Dash 2 Trade would have red-flagged the FTX disaster. This is an innovative bundle of tools: analytics, metrics, signals, auto-trading, and analysis tools. Presently, the D2T presale is still on, as it has raised close to $7 million.
Related
- D2T Price Prediction
- How to Buy D2T
Join Our Telegram channel to stay up to date on breaking news coverage