
Join Our Telegram channel to stay up to date on breaking news coverage
The Bitcoin price prediction slides below the resistance level of $29,291. Further downside momentum appears to be imminent, but $26,000 may likely come out as support.
Bitcoin Prediction Statistics Data:
- Bitcoin price now – $28,968
- Bitcoin market cap – $554.1 billion
- Bitcoin circulating supply – 19.3 million
- Bitcoin total supply – 19.3 million
- Bitcoin Coinmarketcap ranking – #1
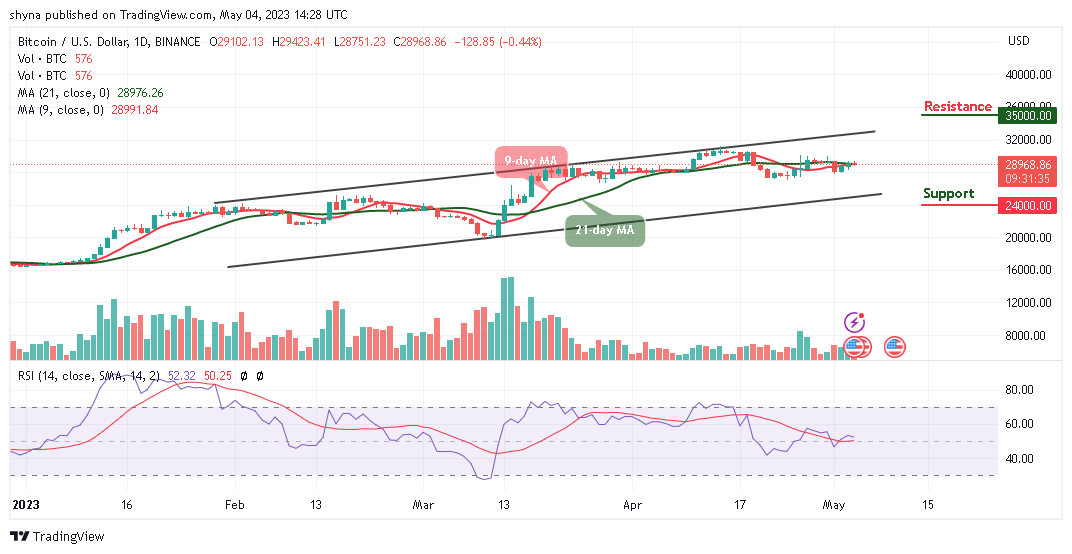
BTC/USD Long-term Trend: Ranging (Daily Chart)
Key levels:
Resistance Levels: $35,000, $37,000, $39,000
Support Levels: $24,000, $22,000, $20,000
BTC/USD soars to $29,423 in the early hours of today’s trading but currently hovering at $28,968 after dropping from the daily high. Moreover, where Bitcoin will go next after this retreat is likely to depend on the ability of the bulls to hold the price above the key support at $28,000.
Bitcoin Price Prediction: Would Bitcoin Go Up?
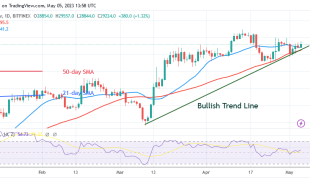
The Bitcoin price is ranging within the 9-day and 21-day moving averages; however, a further retracement seems imminent, and it is likely to break below $28,000. Meanwhile, looking at the chart, $24,000, $22,000, and $20,000 serve as the major support levels, making room for BTC to fall even further. The technical indicator Relative Strength Index (14) is still moving above the 50-level, suggesting sideways movement.
However, as the daily chart reveals, if the bulls could push the price back above the daily high at $29,423, BTC/USD may see a potential resistance level at $30,000, any further movement could send it to other resistance levels at $35,000, $37,000, and $39,000 respectively.
BTC/USD Medium-term Trend: Bearish (4H Chart)
Looking at the 4-hour chart, the bears are coming back into the market as the market price moves to cross below the 9-day and 21-day moving averages. The bulls failed to hold the Bitcoin price above the moving averages. Meanwhile, if BTC/USD breaks above the channel, $31,000 and above may come into play.
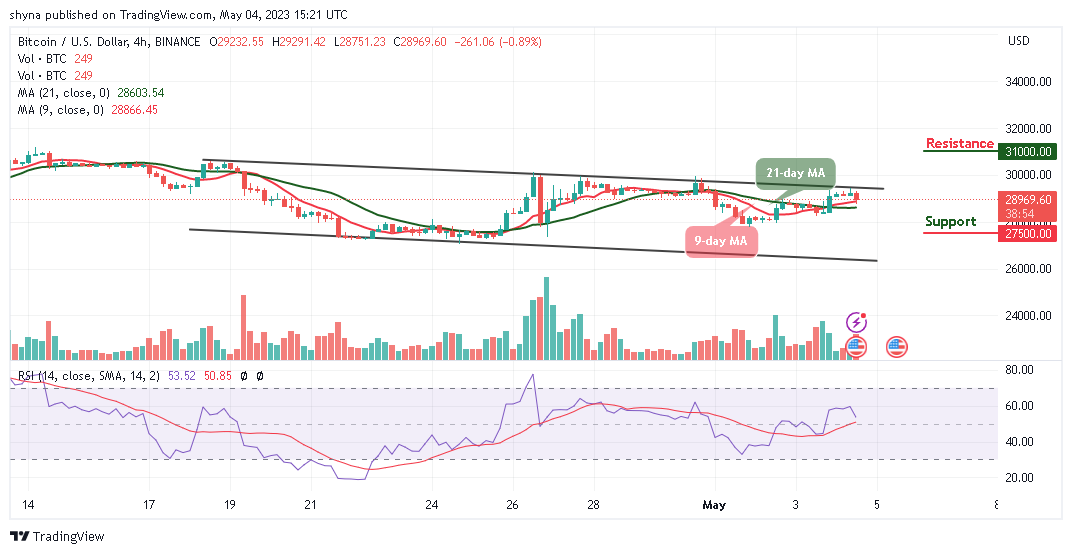
However, if the price breaks toward the lower boundary of the channel and falls more, the support levels of $27,500 and below may be in focus. Meanwhile, as the Relative Strength Index (14) nosedives below 60-level, more bearish signals may play out before a rebound could come in.
Bitcoin Alternatives
The Bitcoin price could face a setback that could be a permanent one if the bears return to the market. The king coin is likely to have an additional bearish run as a price rally could help the coin to head to the south. However, it is likely the red line of the 9-day moving average may go below the green line of the 21-day moving average to confirm the bearish movement. However, Love Hate Inu continue to create a safe space for people to share their opinions with other people who care what they think, and who don’t criticize them for having that opinion. Meanwhile, buying a Love Hate Inu token is a good buy as almost $11 million has been raised so far in the presale.
Join Our Telegram channel to stay up to date on breaking news coverage