Join Our Telegram channel to stay up to date on breaking news coverage
The Bitcoin price prediction shows that BTC may continue to drop below the moving averages as the coin faces the south.
Bitcoin Prediction Statistics Data:
- Bitcoin price now – $28,089
- Bitcoin market cap – $538.6 billion
- Bitcoin circulating supply – 19.3 million
- Bitcoin total supply – 19.3 million
- Bitcoin Coinmarketcap ranking – #1
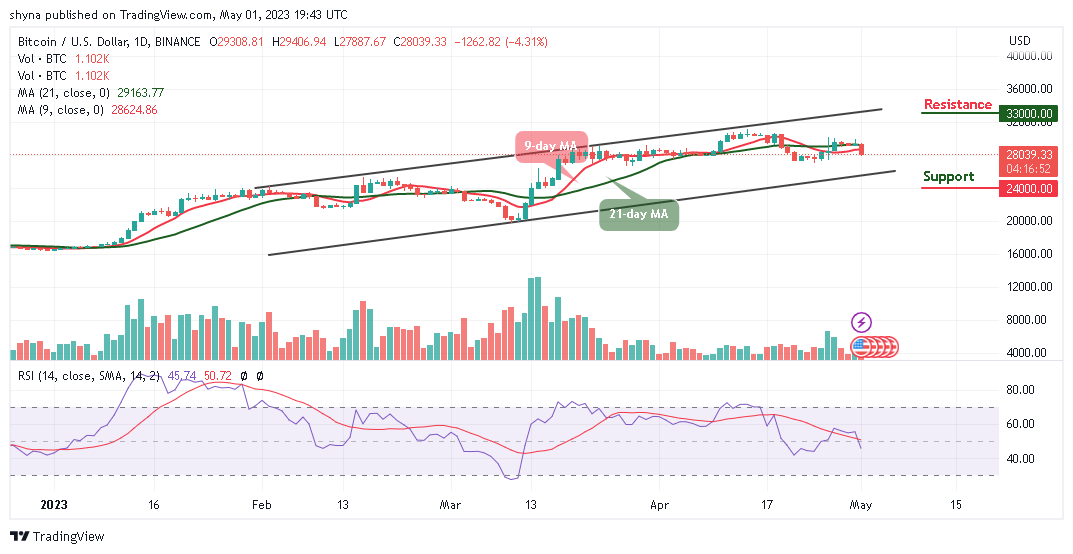
BTC/USD Long-term Trend: Ranging (Daily Chart)
Key levels:
Resistance Levels: $33,000, $35,000 $37,000
Support Levels: $24,000, $22,000, $20,000
BTC/USD could face a setback that may drag the coin below the lower boundary of the channel. However, the king coin is likely to have an additional bearish run if the sellers increase the pressure. At the moment, Bitcoin (BTC) is trading around the $28,039 level.
Bitcoin Price Prediction: Bitcoin (BTC) Could Slide into the Negative Zone
The Bitcoin price is seen crossing below the 9-day and 21-day moving averages as the king coin touches the daily low at $27,887. Therefore, if the price were to break below the $27,000 support level, it is likely to face more downtrends. Nevertheless, the further bearish movement could locate supports at $24,000, $22,000, and $20,000, making room for BTC to fall further.
Moreover, the technical indicator Relative Strength Index (14) is sliding below the 50-level as the trading volume is in support of the bears. Meanwhile, if bulls push the price above the upper boundary of the channel, BTC/USD may move toward the upside to locate the resistance levels at $33,000, $35,000, and $37,000.
BTC/USD Medium-term Trend: Ranging (4H Chart)
On the 4-Hour chart, the Bitcoin price is hovering below the 9-day and 21-day moving averages, the immediate support is likely to come at around the $26,000 level. However, the market price could drop below the lower boundary of the channel if the bears continue to dominate the market.
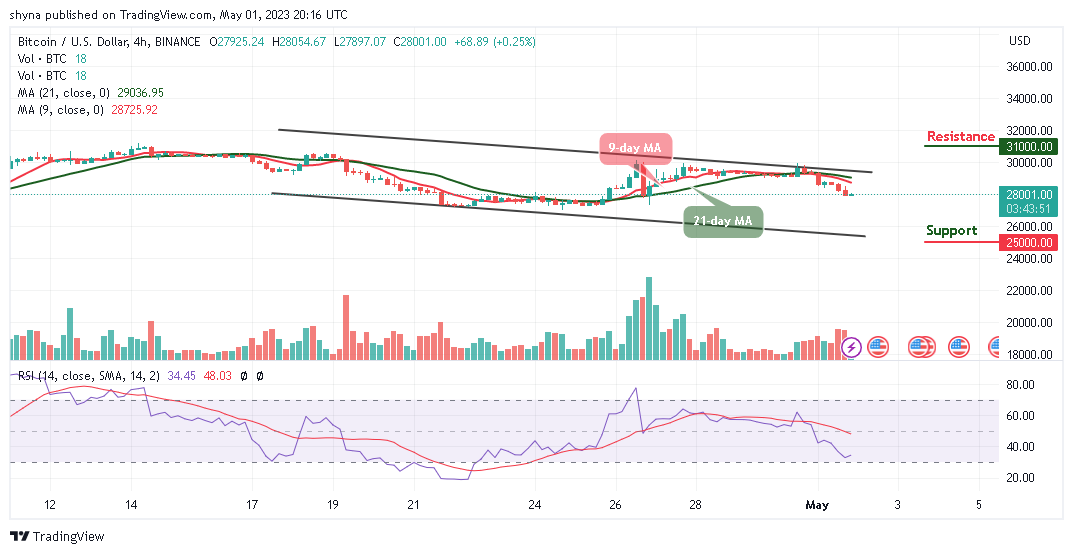
Therefore, a further bearish movement could hit the critical support at the $25,000 level and below, while the resistance could be found above the upper boundary of the channel at $31,000 and above. Meanwhile, the Bitcoin price is likely to face the negative side as the technical indicator Relative Strength Index (14) remains below the 35-level.
Alternatives to Bitcoin
The Bitcoin price could drop more if the king coin slides toward the lower boundary of the channel. But, if the first digital coin breaks below the $26,000 support, it could make the king coin create additional low. Alternatively, Bitcoin (BTC) may reclaim the previous resistance level of $30,000 to head to the upside. However, the Love Hate Inu (LHINU) token is creating a safe space for people to share their opinions with other people who care what they think, and who don’t criticize them for having that opinion. From an investment standpoint, Love Hate Inu is a good buy because of the viral nature of the platform and the token has raised nearly $10 million in the ongoing presale.
Join Our Telegram channel to stay up to date on breaking news coverage