Join Our Telegram channel to stay up to date on breaking news coverage
The Bitcoin price prediction reveals that BTC may break out of the current short-term pattern and move toward the $32,000 level.
Bitcoin Prediction Statistics Data:
- Bitcoin price now – $29,612
- Bitcoin market cap – $574.9 billion
- Bitcoin circulating supply – 19.3 million
- Bitcoin total supply – 19.3 million
- Bitcoin Coinmarketcap ranking – #1
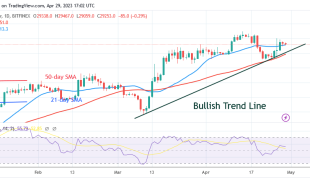
BTC/USD Long-term Trend: Bullish (Daily Chart)
Key levels:
Resistance Levels: $35,000, $37,000, $39,000
Support Levels: $25,000, $23,000, $21,000
BTC/USD is at the moment trading at $29,612 with a 1.39% gain since the beginning of today’s trading. The Bitcoin price may cross above the upper boundary of the channel. Moreover, for BTC/USD to remain above the 9-day and 21-day moving averages, it could make many traders feel that the $29,000 support level could be pretty strong.
Bitcoin Price Prediction: Would BTC Price Break Higher
The Bitcoin price could not drop much cause of today’s trading, but if the first digital coin breaks below the support level of $29,000, it could change the direction of the coin to face the lower boundary of the channel. Alternatively, Bitcoin (BTC) may reclaim the previous resistance level of $30,000 to head to the upside. If successful, BTC/USD could aim at the resistance levels of $35,000, $37,000, and $39,000 respectively.
Nevertheless, the technical indicator Relative Strength Index (14) is moving above the 50-level as the coin consolidates around this level. Moreover, if the king coin slide below the 9-day moving average, this could mean that there may still be a room that could be explored by the bears. Therefore, the support levels of $25,000, $23,000, and $21,000 may play out.
BTC/USD Medium-term Trend: Ranging (4H Chart)
From a technical point of view, on the 4-hour chart, the technical indicator Relative Strength Index (14) is now recovering above the 60-level, this may confirm the bullish movement if it crosses into the overbought region. Meanwhile, adding to the above, there is a little bit of bullish divergence as the coin crosses above the 9-day and 21-day moving averages to continue the bullish movement.
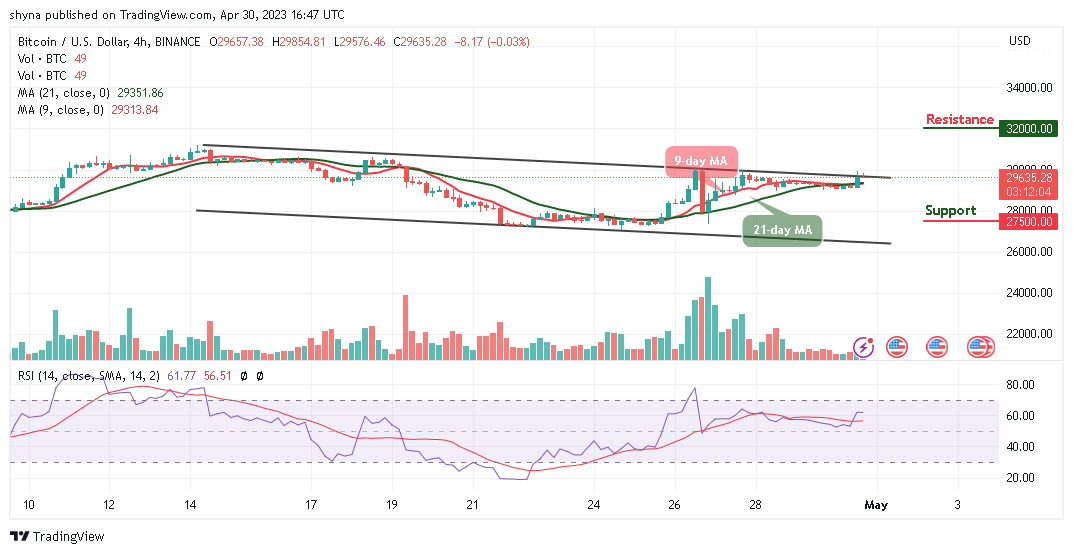
However, if the Bitcoin price heads toward the lower boundary of the channel, the market price could reach support at $27,500 and below. Meanwhile, if the current market value rises and crosses above the upper boundary of the channel, the Bitcoin price could hit the potential resistance level of $32,000 and above.
Bitcoin Alternatives
The Bitcoin price is seen retracing and trading above the 9-day and 21-day moving averages as the market price prepares for the upside. However, any further increase in the bullish movement could push the current market value to the nearest resistance at $30,000. However, the Love Hate Inu token is built on the reliable and secure Ethereum blockchain, the platform ensures top-level security and transparency, making it an attractive option for investors looking to capitalize on the meme coin trend as almost $9 million has been raised in the presale.
Join Our Telegram channel to stay up to date on breaking news coverage