Join Our Telegram channel to stay up to date on breaking news coverage
The Bitcoin price prediction is showing positive signs as the king coin heads to the upside, suggesting further higher levels.
Bitcoin Prediction Statistics Data:
- Bitcoin price now – $27,436
- Bitcoin market cap – $530.3 billion
- Bitcoin circulating supply – 19.3 million
- Bitcoin total supply – 19.3 million
- Bitcoin Coinmarketcap ranking – #1
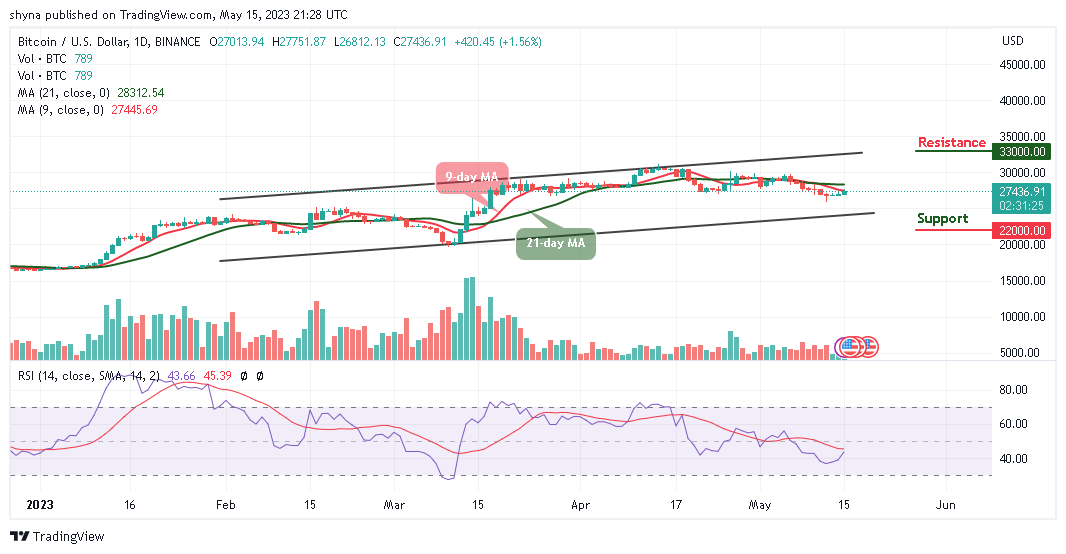
BTC/USD Long-term Trend: Ranging (Daily Chart)
Key levels:
Resistance Levels: $28,000, $30,000, $32,000
Support Levels: $18,000, $16,000, $14,000
According to the daily chart, BTC/USD is heading toward the resistance level of $28,000, the king coin will continue to enjoy a sharp uptrend as long the crypto can keep this trend up. Meanwhile, the Bitcoin price is within touching distance of forming another high above the previous high of $32,000, which is quite remarkable.
Bitcoin Price Prediction: Where is Bitcoin Price Going Next?
The Bitcoin price could be heading toward the upper boundary of the channel as the price establishes a new bullish signal. At the moment, traders could say that the long-term outlook favors the bulls, aiming to cross above the 9-day and 21-day moving averages with eyes now set on the daily resistances at $33,000, $35,000, and $37,000 respectively.
On the contrary, any drop from the current level could lead to declines in the critical support below the moving averages. However, in case BTC drops and revisits the low of $26,800 support, then the coin can rely on the long-term support levels at $22,000, $20,000, and $18,000. Moreover, the technical indicator Relative Strength Index (14) is now moving toward the 50-level, suggesting more bullish signals.
BTC/USD Medium-term Trend: Bearish (4H Chart)
The 4-hour chart reveals that the Bitcoin price is hovering above the 9-day and 21-day moving averages at $27,447. However, BTC/USD could begin to maintain its bull run as the technical indicator Relative Strength Index (14) moves above the 50-level.
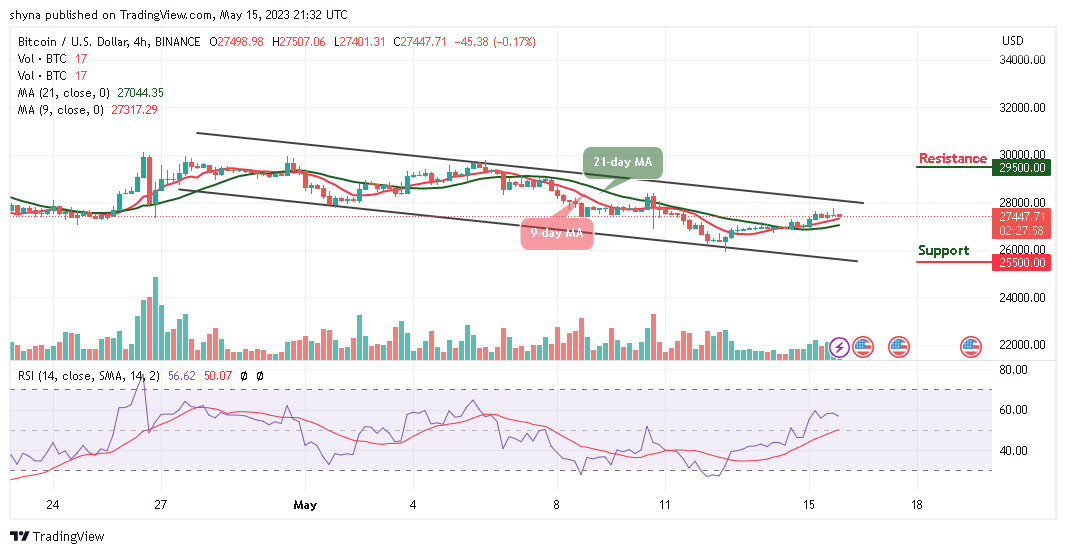
On the contrary, the king coin may take a downward move if the bulls failed to push the price higher, and the coin may breach below the 9-day and 21-day moving averages, which could hit the support at $25,500 and below. Nevertheless, if the bulls find a decent resistance level of above $28,000, the king coin may cross above the channel which could hit the resistance level of $29,500 and above.
Bitcoin Alternatives
At the time of writing, the Bitcoin price is making an attempt to cross above the upper boundary of the channel, and if it keeps moving to the upside, the market price could touch the nearest resistance level of $28,000. Moreover, the chart reveals that there is likely to be a little bullish movement within the market as the technical indicator could face the upside. However, AiDoge is a crypto startup, meaning it requires funding from investors to achieve its goals. This is why AiDoge has just launched its much-anticipated presale campaign. Meanwhile, the token has raised almost $10 million in the ongoing presale.
Join Our Telegram channel to stay up to date on breaking news coverage