
Join Our Telegram channel to stay up to date on breaking news coverage
The Bitcoin price prediction shows that BTC keeps following the sideways movement as the king coin fails to spike higher.
Bitcoin Prediction Statistics Data:
- Bitcoin price now – $26,988
- Bitcoin market cap – $521.6 billion
- Bitcoin circulating supply – 19.3 million
- Bitcoin total supply – 19.3 million
- Bitcoin Coinmarketcap ranking – #1
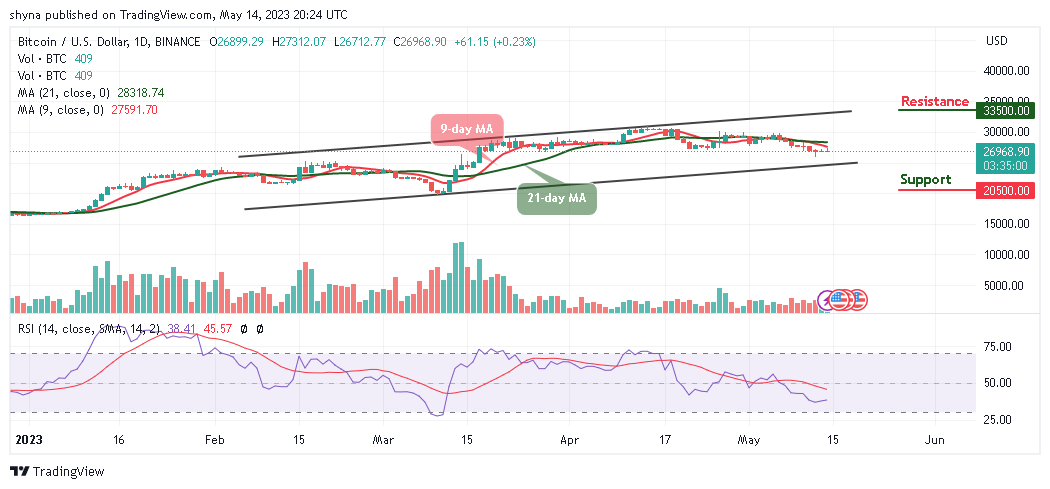
BTC/USD Long-term Trend: Ranging (Daily Chart)
Key levels:
Resistance Levels: $33,500, $35,500, $37,500
Support Levels: $20,500, $18,500, $16,500
At the time of writing, the Bitcoin price is yet to trade above the resistance level of $27,000, but there seems to be room for losses after the king coin failed to move near the upper boundary of the channel. BTC/USD is hovering at $26,968 but the king coin has not been able to cross above the 9-day and 21-day moving averages.
Bitcoin Price Prediction: BTC Price May Consolidate Before the Next Action
According to the daily chart, the Bitcoin price might see further sideways price action as additional losses could play out until there is a change in the price movement. However, as the Bitcoin price ranges, the coin could rise and cross the moving averages. On that note, the technical indicator Relative Strength Index (14) moves to cross above the 40-level, this could mean that the king coin may be ready for the upside.
Looking at it from above, recovery could be set in bit by bit as the bulls may push the Bitcoin price above the resistance level of $27,000, and a sustainable movement near the upper boundary of the channel could allow for an extended recovery in the direction of the potential resistance levels at $33,500, $35,500, and $37,500. On the downside, any bearish movement below the lower boundary of the channel may cause the Bitcoin price to hit the supports at $20,500, $18,500, and $16,500.
BTC/USD Medium-term Trend: Bearish (4H Chart)
Looking at the 4-hour chart, the Bitcoin price is likely to cross below the 9-day and 21-day moving averages. However, if the king coin trade bullishly, it may cross above the upper boundary of the channel where it could locate the resistance level of $29,000 and above.
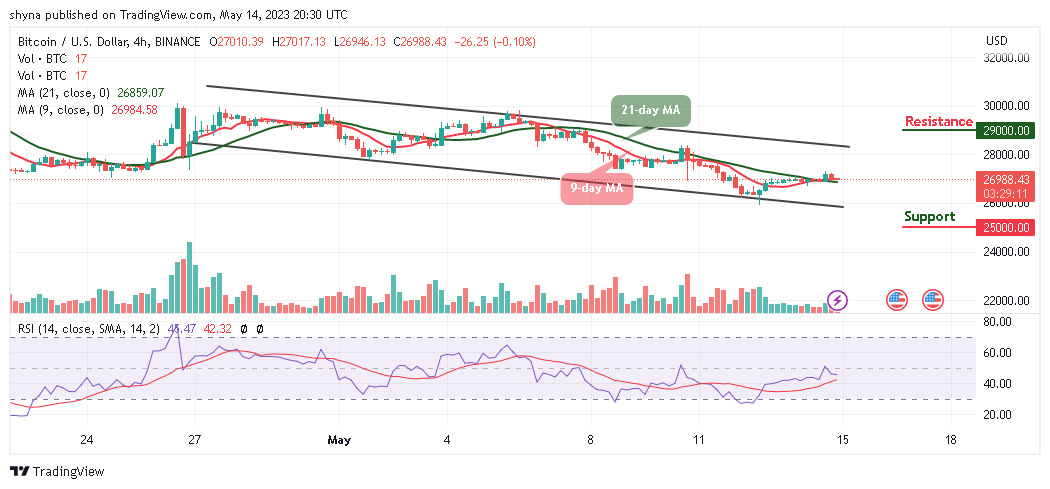
Nevertheless, if the bearish movement increases, the Bitcoin price is likely to cross below the lower boundary of the channel and could touch the support level of $25,000 and below. Meanwhile, the technical indicator Relative Strength Index (14) is likely to slide below the 50-level to confirm the bearish movement.
Alternatives to Bitcoin
As the Bitcoin price moves toward the east, it is likely to slide and cross below the lower boundary of the channel as the technical indicator Relative Strength Index (14) moves in the same direction below the 40-level and this could mean that the king coin is not yet ready for the upside. However, many AI tools require users to purchase credits. This is to avoid system overload and to ensure that bots and bad actors do not attack the technology. In the case of AiDoge, users need to use credits every time they wish to create a new meme and the token has raised almost $9 million in the ongoing presale.
Read more:
- Bitcoin Price Prediction: BTC/USD Battles $10,800 Resistance, Poises to Retest the $11,000 High
Join Our Telegram channel to stay up to date on breaking news coverage