Join Our Telegram channel to stay up to date on breaking news coverage
The Bitcoin price prediction shows BTC rebounds from the daily low of $26,722 as buying interest may increase the bullish movement.
Bitcoin Prediction Statistics Data:
- Bitcoin price now – $26,922
- Bitcoin market cap – $519.5 billion
- Bitcoin circulating supply – 19.3 million
- Bitcoin total supply – 19.3 million
- Bitcoin Coinmarketcap ranking – #1
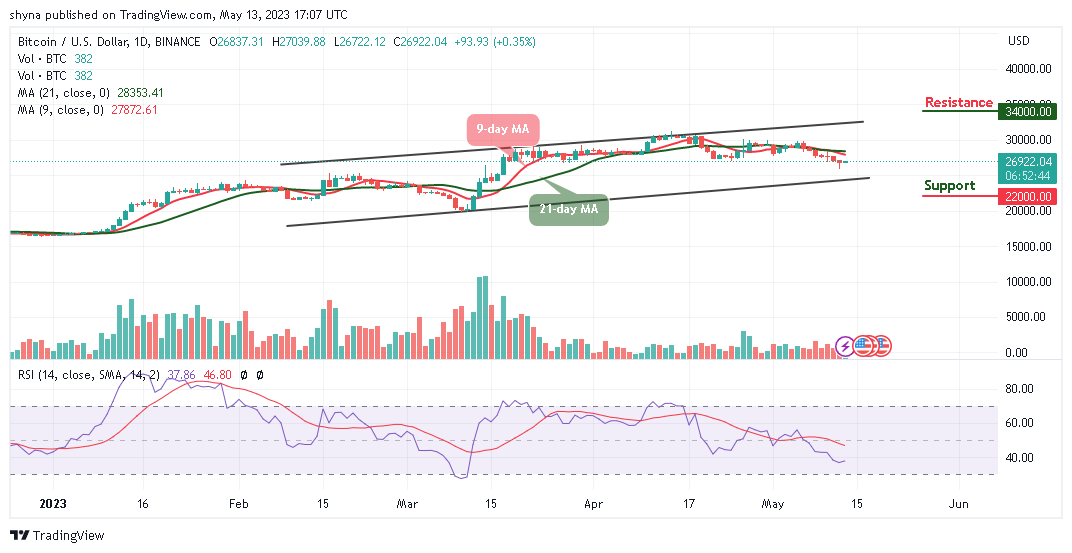
BTC/USD Long-term Trend: Ranging (Daily Chart)
Key levels:
Resistance Levels: $34,000, $36,000, $38,000
Support Levels: $22,000, $20,000, $18,000
BTC/USD may continue to fall if the market price stays below the 9-day and 21-day moving averages. However, as the market establishes a move toward the resistance level of $27,000, the buyers may continue to look for additional resistance levels on their way to the 9-day moving average.
Bitcoin Price Prediction: BTC Price May Reclaim $27,000 Resistance
According to the daily chart, after the Bitcoin price begins the daily trade at $26,837, the king coin is now looking forward to reclaiming more resistance levels. However, the daily chart reveals that if the 9-day moving average crosses above the 21-day moving average, it may confirm the next direction that the coin will follow. In other words, BTC/USD may decline if the price breaks toward the lower boundary of the channel, but it could rise if the $28,000 resistance is reached.
At the time of writing, the technical indicator Relative Strength Index (14) may likely cross above the 40-level to confirm the bullish movement. Meanwhile, if the king coin crosses above the upper boundary of the channel, it could reach the resistance levels of $34,000, $36,000, and $38,000 but any movement below the lower boundary of the channel could hit the supports at $22,000, $20,000, and $18,000.
BTC/USD Medium-term Trend: Bearish (4H Chart)
According to the 4-hour chart, the Bitcoin price is seen hovering within the 9-day and 21-day moving averages as the technical indicator Relative Strength Index crosses above the 40-level. However, if the Bitcoin price moves toward the upper boundary of the channel, the bullish influence could spike, and the acquired more gains.
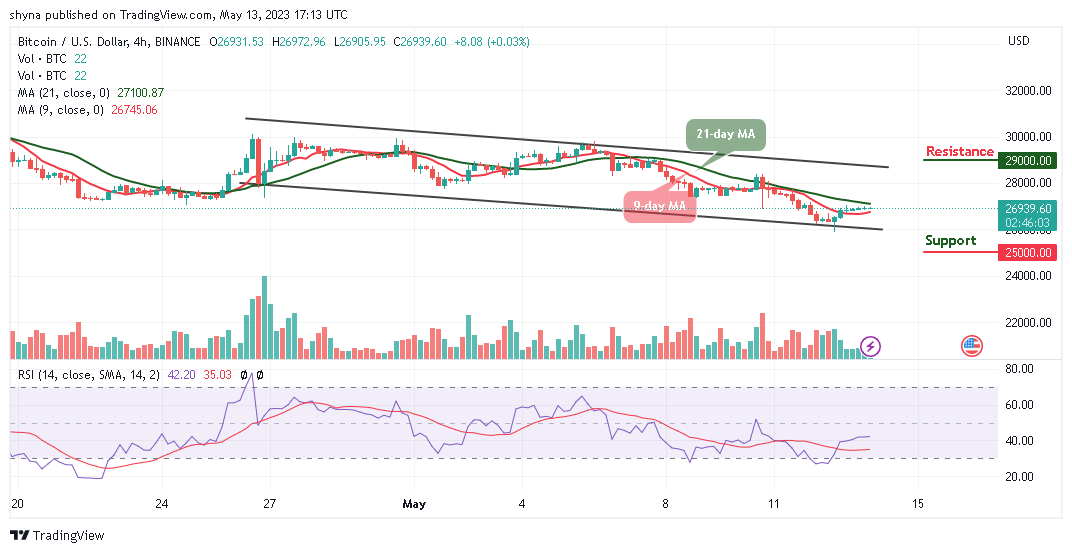
However, should in case the current candle fail to move bullishly, the Bitcoin price may slide toward the support level of $25,000 and below. Furthermore, the bulls may need to keep the coin above the resistance level of $28,000 in other to break the potential resistance at $29,000 and above.
Bitcoin Alternatives
Over the past few days, the Bitcoin price has been struggling to break toward the upper boundary of the channel. In today’s session, the coin attempted to push higher but the sellers step in and start pushing the coin lower to touch the daily low of $26,722. Meanwhile, one of the best things about the AiDoge (AI) project is that it operates a simple yet highly innovative model. In simple terms, AiDoge enables users to automatically generate memes. This is achieved by providing AiDoge with a text prompt and the token has raised almost $8 million in the presale.
Join Our Telegram channel to stay up to date on breaking news coverage