Join Our Telegram channel to stay up to date on breaking news coverage
The Bitcoin price prediction indicates bearish momentum as the coin fails to cross above the 9-day and 21-day moving averages.
Bitcoin Prediction Statistics Data:
- Bitcoin price now – $29,986
- Bitcoin market cap – $521.7 billion
- Bitcoin circulating supply – 19.3 million
- Bitcoin total supply – 19.3 million
- Bitcoin Coinmarketcap ranking – #1
BTC/USD Long-term Trend: Ranging (Daily Chart)
Key levels:
Resistance Levels: $32,000, $34,000, $36,000
Support Levels: $22,000, $20,000, $18,000
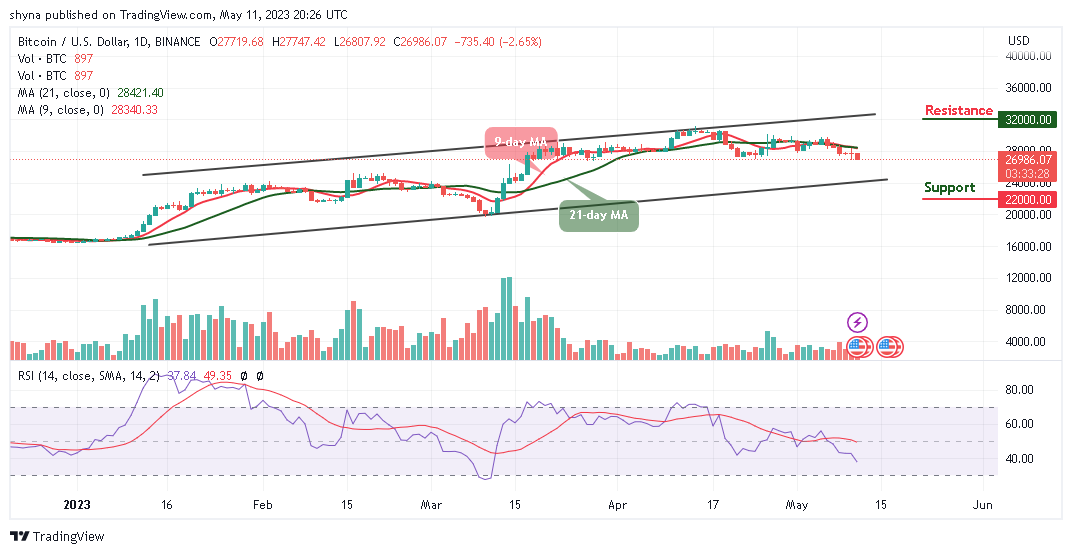
BTC/USD keeps hovering around $26,986 as the king coin has not been able to reclaim the resistance level of $28,000 consolidating below the 9-day and 21-day moving averages. At the moment the Bitcoin price may continue to follow the sideways movement, but the daily chart shows that the formation of a bearish movement is likely to play out.
Bitcoin Price Prediction: BTC Price May Consolidates to the Downside
As the Bitcoin price remains below the 9-day and 21-day moving averages, BTC/USD may slide toward the lower boundary of the channel while the technical indicator Relative Strength Index (14) crosses below 40-level, which confirms the bearish movement. This could mean that the King coin is not yet ready for the upside until the red line of the 9-day moving average crosses above the green line of the 21-day moving average.
Nevertheless, recovery may not come easy as bears may bring the king coin toward the lower boundary of the channel. Meanwhile, if the bulls return to the market, a sustainable move above the 9-day and 21-day moving averages may locate the resistance level of $28,000, which may allow for an extended recovery toward the potential resistance levels at $32,000, $34,000, and $36,000. However, an increase in selling pressure may bring the Bitcoin price toward the supports at $22,000, $20,000, and $18,000.
BTC/USD Medium-term Trend: Ranging (4H Chart)
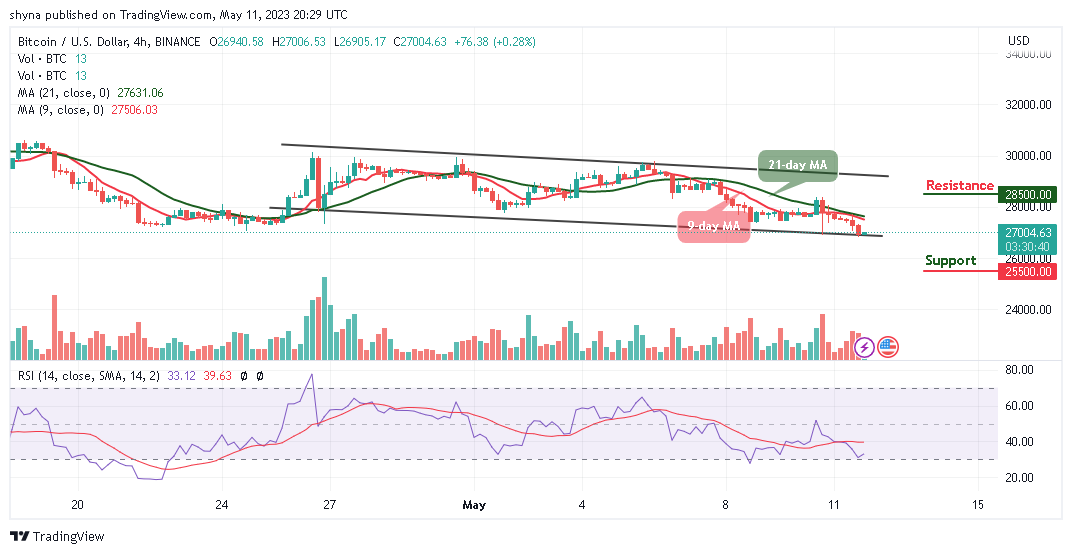
Looking at the 4-hour chart, the Bitcoin price is trading below the 9-day and 21-day moving averages. BTC/USD may head to the upside as the market moves to recover from the bearish momentum. However, if the price breaks above the moving averages, higher resistance could be located at $28,500 and above. On the contrary, the technical indicator Relative Strength Index (14) is still below the 35-level.

Moreover, if the bearish movement steps back, the support level of $26,000 may not be able to hold the selling pressure. Therefore, BTC/USD could fall to $25,500 and below if the price faces the downside.
Alternatives to Bitcoin
The Bitcoin price continues to face a setback that could be a permanent one. The king coin is likely to have an additional bearish run but a price rally may help the coin to head to the south as the red line of the 9-day moving average could go below the green line of the 21-day moving average. However, AiDoge is a recently founded blockchain project that has built a meme generation tool that is fueled by AI. In a nutshell, users can enter simple text prompts explaining what memes they want to create. Then, the AiDoge tool will not only generate a high-quality meme based on the prompt but one that is 100% unique as almost $8 million has been raised so far.
Join Our Telegram channel to stay up to date on breaking news coverage


