Join Our Telegram channel to stay up to date on breaking news coverage
The Bitcoin price prediction shows that BTC is trading above the 9-day and 21-day moving averages as the recovery comes slowly.
Bitcoin Prediction Statistics Data:
- Bitcoin price now – $20,896
- Bitcoin market cap – $402.7 billion
- Bitcoin circulating supply – 19.2 million
- Bitcoin total supply – 19.2 million
- Bitcoin Coinmarketcap ranking – #1
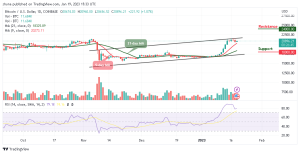
BTC/USD Long-term Trend: Ranging (Daily Chart)
Key levels:
Resistance Levels: $24,000, $26,000, $28,000
Support Levels: $18,000, $16,000, $14,000
At the time of writing, BTC/USD is seen trading at $20,896 after soaring toward the upper boundary of the channel. The first digital asset is seen pulling back to where it is currently trading and may head downwards if the bears step back into the market.
Bitcoin Price Prediction: Bitcoin (BTC) May Consolidate
According to the daily chart, the Bitcoin price needs to keep hovering above the moving averages so that it could cross above the upper boundary of the channel, otherwise, there may come a bearish breakdown which could take the king coin to the south. Meanwhile, the 9-day MA is well above the 21-day MA, and the technical indicator Relative Strength Index (14) sends moderate signs where an oscillation to the higher boundary may confirm the proper trend.
However, BTC/USD may confirm the bullish trend if the market price moves above $21,000. On the contrary, the Bitcoin price may follow the bearish trend if the price crosses below the 9-day moving average. Should this happen, the king coin may slide to the support levels of $18,000, $16,000, and $14,000 respectively. Otherwise, a strong bullish spike may push the price toward the resistance levels of $24,000, $26,000, and $28,000.
BTC/USD Medium-term Trend: Ranging (4H Chart)
The 4-hour chart reveals that Bitcoin (BTC) is currently trading below the 9-day and 21-day moving averages. Meanwhile, if the price continues to rise further and moves towards the upper boundary of the channel, it could reach the nearest resistance level at $23,000 and above.
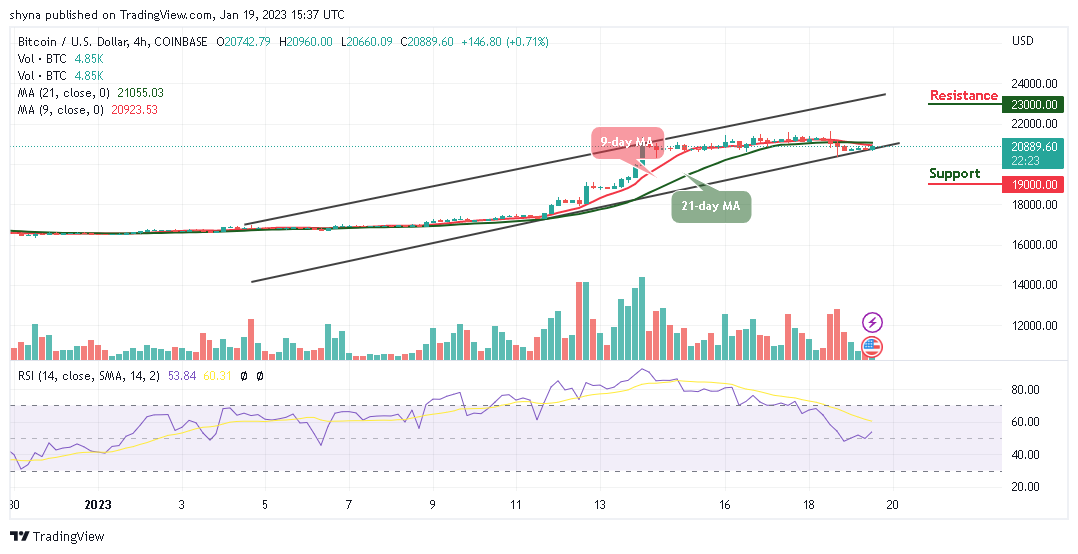
In other words, if the bears bring the price below the lower boundary of the channel, it could reach the closest support at $19,000 and below. Now, the technical indicator Relative Strength Index (14) is hovering above the 50-level, suggesting bullish movement within the market.
However, Meta Masters Guild (MEMAG) is the most rapidly growing Play-to-Earn guild of this year. Therefore, it is going to be the biggest mobile gaming guild in Web3. Fun and interesting games, which are compatible with NFTs, are created. And there, community members are rewarded as they speculate and also invest. The MEMAG presale is ongoing and close to $1 million has been raised so far.
Related
- Meta Masters Guild – The Fastest Growing Play-to-Earn Guild of 2023
- How to buy MEMAG
Join Our Telegram channel to stay up to date on breaking news coverage