Join Our Telegram channel to stay up to date on breaking news coverage
After touching the daily high of $21,378, the Bitcoin price prediction shows that BTC could begin a downside correction.
Bitcoin Prediction Statistics Data:
- Bitcoin price now – $21,217
- Bitcoin market cap – $412.7 billion
- Bitcoin circulating supply – 19.2 million
- Bitcoin total supply – 19.2 million
- Bitcoin Coinmarketcap ranking – #1
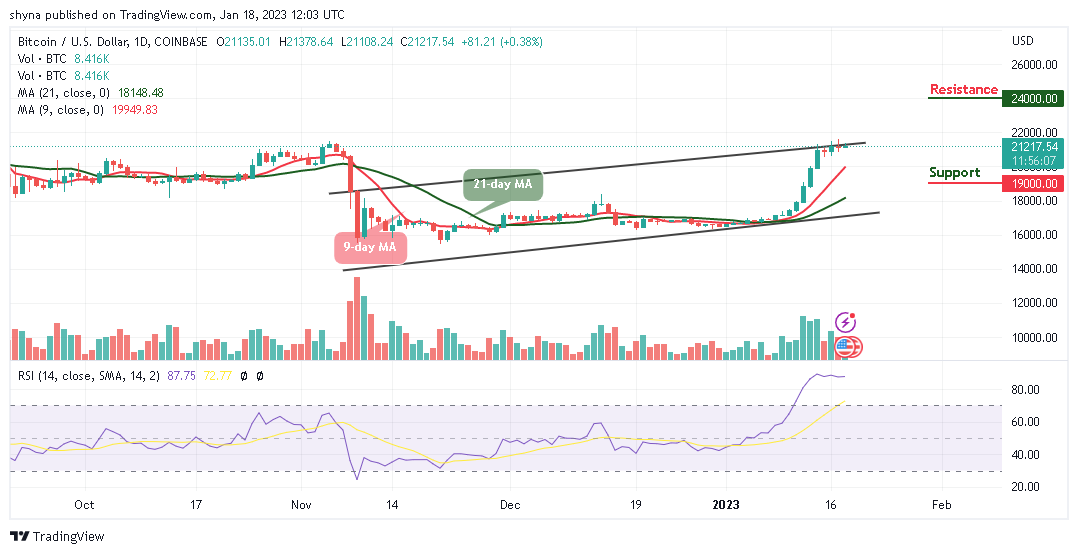
BTC/USD Long-term Trend: Bullish (Daily Chart)
Key levels:
Resistance Levels: $24,000, $26,000, $28,000
Support Levels: $19,000, $17,000, $15,000
BTC/USD is yet to hit the potential resistance level of $22,000 level as buying pressure cooled off. The market price is hovering around $21,217 to form a low near $21,000 before stabilizing. As of now, the Bitcoin price is yet to cross above the upper boundary of the channel but it is up by 0.38%.
Bitcoin Price Prediction: Will BTC Soar Higher Again?
After a strong week for BTC/USD and many other leading cryptos, traders are now on the lookout for indicators of what could spark the next bull run. The Bitcoin price is likely to face sideways movement, but a decisive breakout below $21,000 support could intensify selling pressure. However, if bears push the market price downwards, the consolidation may turn into a bear run.
Therefore, the current sideways movement according to the technical indicator is likely to continue, but the next hurdle for the king coin could emerge at $22,000. However, the technical indicator Relative Strength Index (14) is within the overbought region, a reversal is possible but only if the resistance at $21,500 is reclaimed. Meanwhile, the persistence trade above this level may technically push the coin to the resistance levels of $24,000, $26,000, and $28,000 while the supports lie at $19,000, $17,000, and $15,000.
BTC/USD Medium-term Trend: Ranging (4H Chart)
Looking at the 4-Hour chart, Bitcoin (BTC) has not yet slipped below $21,000 but the price is in the loop of making a bounce back. At the moment, BTC/USD hovers within the 9-day and 21-day moving averages trading around $21,362.94. Therefore, it could take time to cross above the upper boundary of the channel.
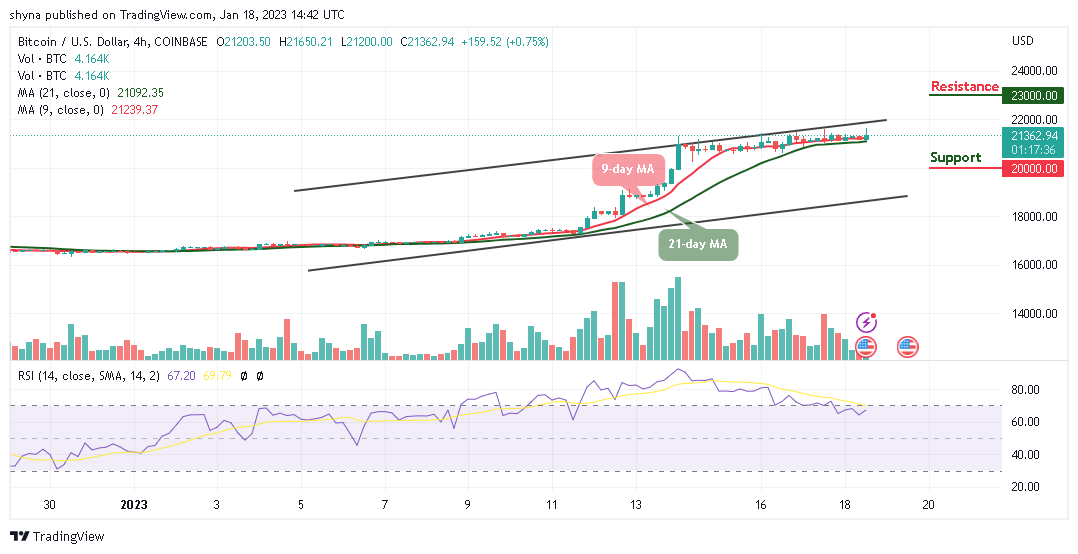
However, if the bulls energize the market, the price could test the resistance level of $23,000 and above. In other words, if bears should hold the price, and drag it downward, then the support level of $20,000 and below may be visited as the Relative Strength Index (14) moves to cross above the 70-level, indicating additional bullish movement.
However, Meta Masters Guild (MEMAG) is the most rapidly growing Play-to-Earn guild of this year. Therefore, it is going to be the biggest mobile gaming guild in Web3. Fun and interesting games, which are compatible with NFTs, are created. And there, community members are rewarded as they speculate and also invest. The MEMAG presale is ongoing and close to $500,000 has been raised so far.
Related
- Meta Masters Guild – The Fastest Growing Play-to-Earn Guild of 2023
- How to buy MEMAG
Join Our Telegram channel to stay up to date on breaking news coverage