Join Our Telegram channel to stay up to date on breaking news coverage
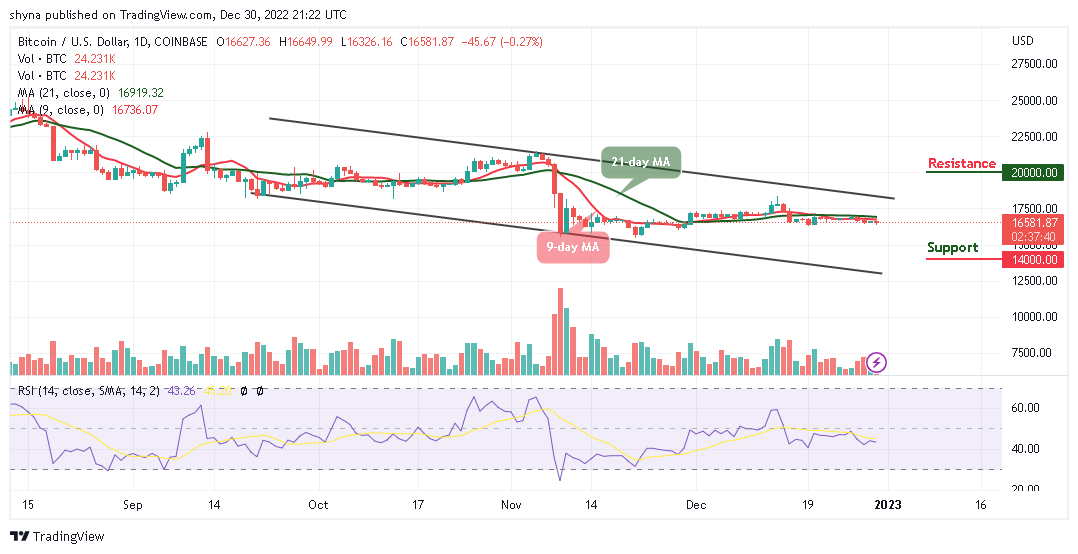
The Bitcoin price prediction shows that BTC slumps below the resistance level of $16,700 as further downside momentum appears to be imminent.
Bitcoin Prediction Statistics Data:
- Bitcoin price now – $16,581
- Bitcoin market cap – $319.5 billion
- Bitcoin circulating supply – 19.2 million
- Bitcoin total supply – 19.2 million
- Bitcoin Coinmarketcap ranking – #1
BTC/USD Long-term Trend: Ranging (Daily Chart)
Key levels:
Resistance Levels: $20,000, $22,000, $24,000
Support Levels: $14,000, $12,000, $10,000
BTC/USD touches the resistance level of $16,649 during the European session today but the king coin could not cross above this level to gain to the upside. However, where Bitcoin will go next after this retreat is likely to depend on the ability of the bulls to hold the price above the key resistance at $17,000.
Bitcoin Price Prediction: Would Bitcoin Go Up or Down?
The Bitcoin price remains intact below the 9-day and 21-day moving averages; however, a further retracement seems imminent and it is likely to break toward the lower boundary of the channel. Looking at the daily chart, the major support levels could be found at $14,000, $12,000, and $10,000, making room for BTC to fall even further. However, the technical indicator Relative Strength Index (14) is still moving above the 40-level, suggesting sideways movement.
However, as the daily chart reveals, if the bulls could push the price above the upper boundary of the channel, BTC/USD may see a potential resistance level at $17,000, any further movement could send it to other resistance levels at $20,000, $22,000, and $24,000 respectively.
BTC/USD Medium-term Trend: Bearish (4H Chart)
Looking at the 4-hour chart, the bulls are resuming back into the market as the king coin moves to cross above the 9-day and 21-day moving averages. The bulls will need to push the Bitcoin price above the moving averages to confirm the bullish movement. However, if BTC/USD crosses above the upper boundary of the channel, the resistance level of $17,500 and above could play out.
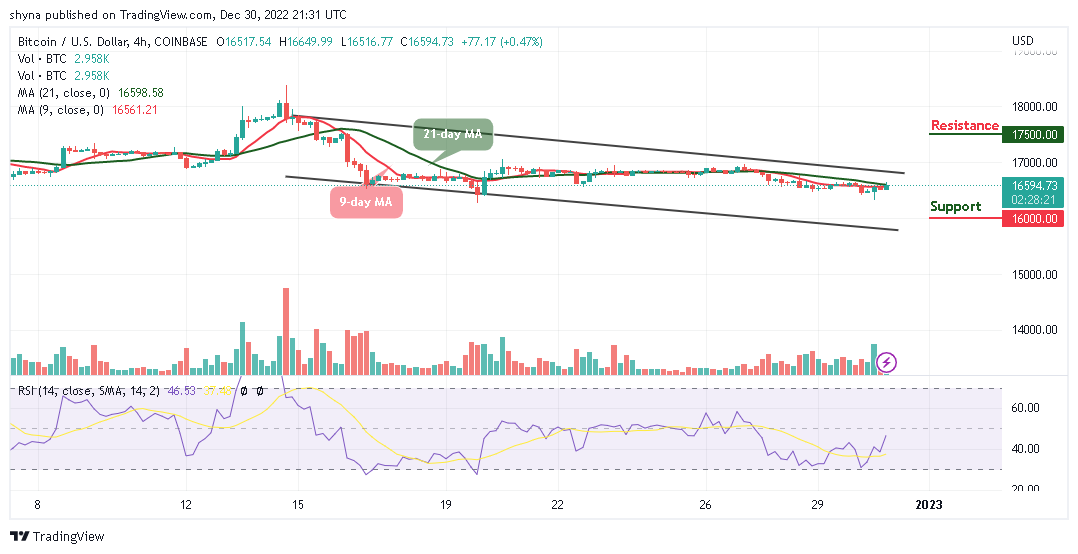
Nonetheless, if the price breaks to the south and faces the lower boundary of the channel, the support level of $16,000 and below could be located. Meanwhile, as the Relative Strength Index (14) moves to cross above the 50-level, more bullish signals may play out as the king coin embarks on the positive movement.
Best Wallet - Diversify Your Crypto Portfolio

- Easy to Use, Feature-Driven Crypto Wallet
- Get Early Access to Upcoming Token ICOs
- Multi-Chain, Multi-Wallet, Non-Custodial
- Now On App Store, Google Play
- Stake To Earn Native Token $BEST
- 250,000+ Monthly Active Users
Join Our Telegram channel to stay up to date on breaking news coverage