Join Our Telegram channel to stay up to date on breaking news coverage
Following the $16,500 break, the Bitcoin price prediction shows BTC dropping slightly after getting rejected at $16,638.
Bitcoin Prediction Statistics Data:
- Bitcoin price now – $19,335
- Bitcoin market cap – $370.6 billion
- Bitcoin circulating supply – 19.1 million
- Bitcoin total supply – 19.1 million
- Bitcoin Coinmarketcap ranking – #1
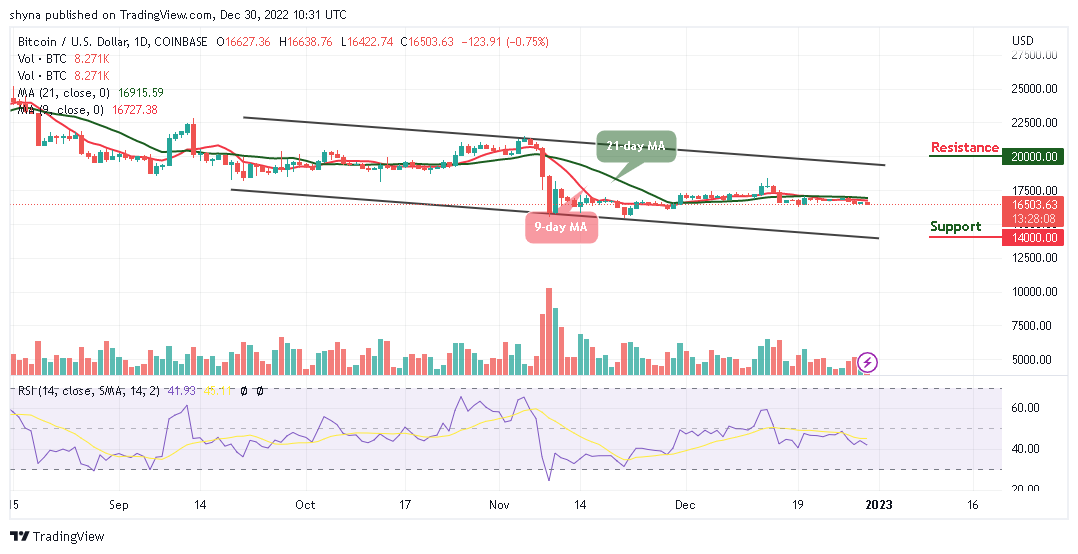
BTC/USD Long-term Trend: Ranging (Daily Chart)
Key levels:
Resistance Levels: $20,000, $22,000, $24,000
Support Levels: $14,000, $12,000, $10,000
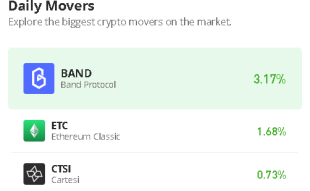
BTC/USD is now showing slight negative signals after touching the resistance level of $42,237 today. The Bitcoin price fails to make any ground towards the upper boundary of the channel. Therefore, the Bitcoin price is dropping heavily with a loss of 1.68% within 24 hours of trading as it touches the daily low of $40,505.
Bitcoin Price Prediction: Bitcoin Price Could Go Lower
The daily chart reveals that the Bitcoin price continues to develop some signs of weakness in the past few days. Therefore, the resistance provided during the European session continues to fail each time it attempts to break, and head toward the upper boundary of the channel. However, the market price remains bearish as the signal line of the Relative Strength Index (14) moves to cross below the 40-level.
In the meantime, the Bitcoin price needs to break the $17,000 resistance to make the market bullish. But, if the sellers push the market price beneath the support at $16,000, the next level of support could lie at $15,000. Wherefore, beneath this, additional supports could be found at $14,000, $12,000, and $10,000 respectively. Moreover, should in case the bulls regroup and push higher, the Bitcoin price could hit the potential resistance levels at $20,000, $22,000, and $24,000.
BTC/USD Medium-term Trend: Bearish (4H Chart)
Looking at the 4-hour chart, BTC/USD is trending in a downward channel formation. During the European session today, Bitcoin (BTC) touches the resistance level of $16,522.95 before retreating to where it is currently changing hands at $16,505. Meanwhile, further bearish movement could locate the support level at $16,000 and below.
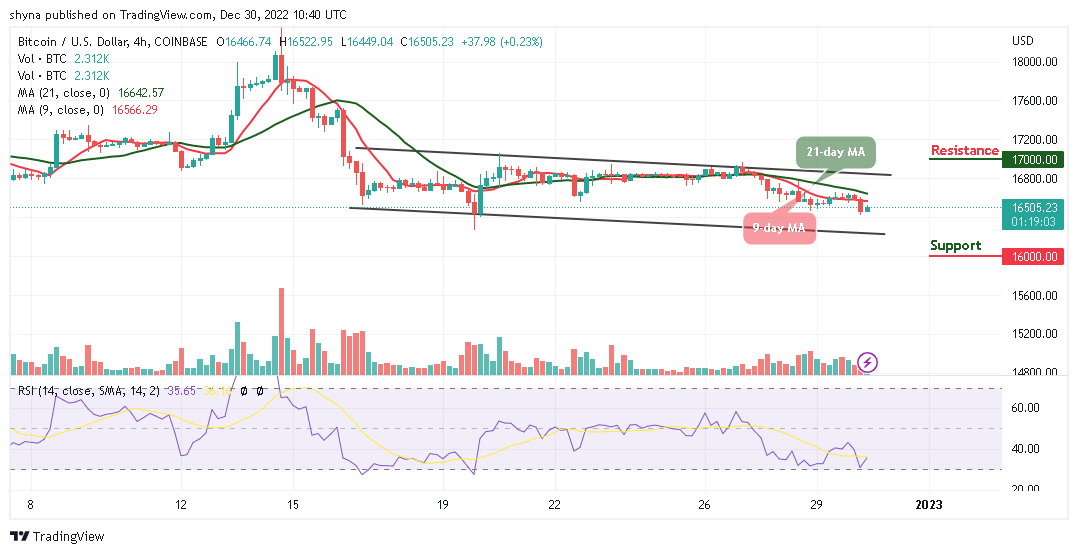
However, the technical indicator Relative Strength Index (14) is recovering from the oversold region, now moving towards the 40-level. However, the Bitcoin price is rising toward the 9-day and 21-day moving averages; further bullish movements could push the price to the potential resistance level of $17,000 and above.
Read more:
- Bitcoin Cash Price Prediction: BCH/USD Couldn’t Push Higher; Price Drops Below $290
- Litecoin Price Prediction – LTC/USD Reached $53; Does Not Seem to Be a Good Day for Traders
Best Wallet - Diversify Your Crypto Portfolio

- Easy to Use, Feature-Driven Crypto Wallet
- Get Early Access to Upcoming Token ICOs
- Multi-Chain, Multi-Wallet, Non-Custodial
- Now On App Store, Google Play
- Stake To Earn Native Token $BEST
- 250,000+ Monthly Active Users
Join Our Telegram channel to stay up to date on breaking news coverage