Join Our Telegram channel to stay up to date on breaking news coverage
The Bitcoin price prediction shows that BTC sees a 0.63% decline after trading near the $17,000 resistance level, the first digital asset heads lower.
Bitcoin Prediction Statistics Data:
- Bitcoin price now – $16,593
- Bitcoin market cap – $319.5 billion
- Bitcoin circulating supply – 19.2 million
- Bitcoin total supply – 19.2 million
- Bitcoin Coinmarketcap ranking – #1
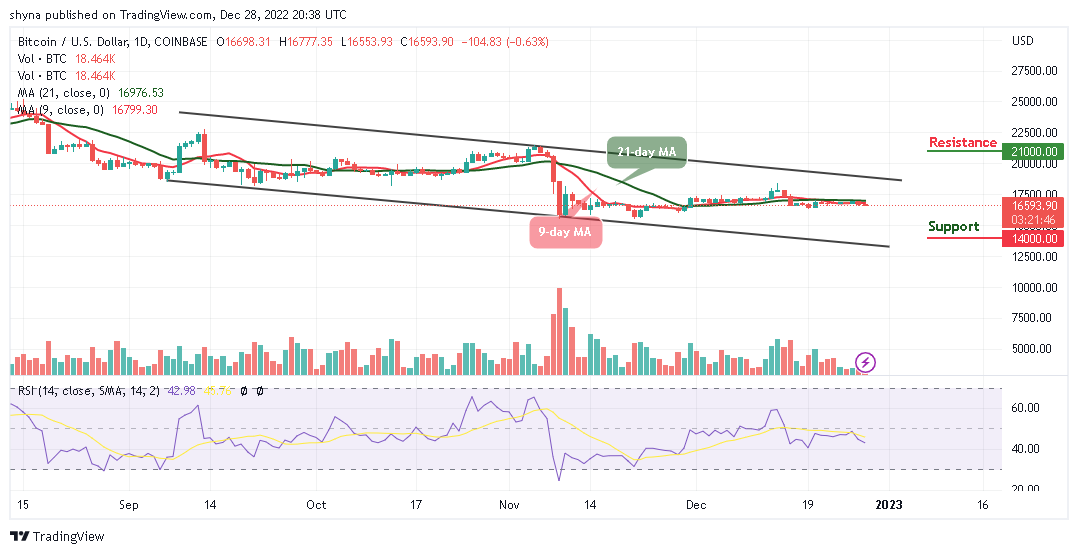
BTC/USD Long-term Trend: Ranging (Daily Chart)
Key levels:
Resistance Levels: $21,000, $23,000, $25,000
Support Levels: $14,000, $12,000, $10,000
BTC/USD loses its momentum after trading near the resistance level of $17,000. As of writing, the king coin is down 0.63% on the day at $16,733 below the 9-day and 21-day moving averages. Meanwhile, Bitcoin (BTC) may struggle to close above $17,000 and if it does, it should be free to rise well above $18,000 if it moves in the next positive direction.
Bitcoin Price Prediction: Bitcoin (BTC) Range-bounds
After a slightly positive move above $16,700, the Bitcoin price is sliding below the 9-day and 21-day moving averages. Over the past few days, the king coin has been struggling to break toward the upper boundary of the channel. However, in today’s session, the coin attempted to push higher, but the sellers step in and begin to bring the coin lower to touch the daily low of $16,553.
Moreover, if the coin moves lower, the $16,500 may serve as the nearest support level, which may likely make room for the coin to fall further to hit the support levels at $14,000, $12,000, and $10,000. The Relative Strength Index (14) remains below the 50-level indicating a bearish movement. On the contrary, BTC/USD may likely see resistance levels of $21,000, $23,000, and $25,000 if it finds its way above the upper boundary of the channel.
BTC/USD Medium-term Trend: Bearish (4H Chart)
On the 4-Hour chart, the BTC price hovers around $16,591 and could take time to cross above the 9-day and 21-day moving averages. More so, if the bulls gather enough strength, the upward movement may be able to near the resistance level of $17,500 and above.
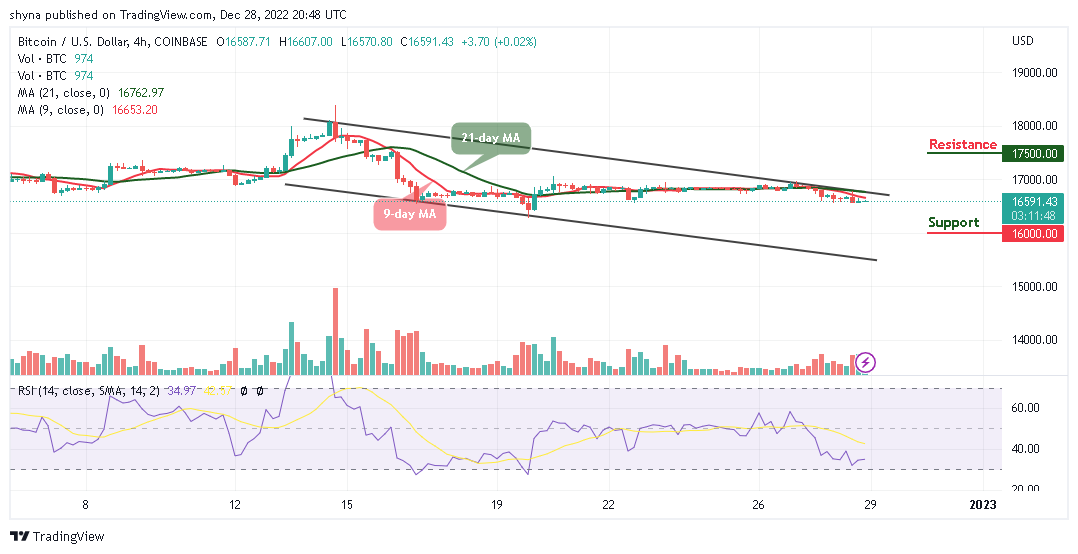
On the downside, immediate support could be located around the $16,500 level while critical support is at $16,000 and below. Therefore, the Bitcoin price may likely fall towards the lower boundary of the channel if the bears put more pressure on the market, Moreover, the Relative Strength Index (14) moves to cross below the 30-level, suggesting bearish movement.
However, Dash 2 Trade gives you the ability to optimize your trading and speculative profitability with effective crypto trading recommendations, auto trading, and analytics features. There is a D2T token presale ongoing and time is running out. The presale dashboard launch is coming soon since the product dev is ahead of the schedule. So far, the presale has raised almost $12 million.
Related
- D2T Price Prediction
- How to Buy D2T
Join Our Telegram channel to stay up to date on breaking news coverage