

Join Our Telegram channel to stay up to date on breaking news coverage
The Bitcoin price prediction shows that BTC slides below the resistance level of $16,900 as further downside momentum may come to play.
Bitcoin Prediction Statistics Data:
- Bitcoin price now – $16,622.12
- Bitcoin market cap – $320.8 billion
- Bitcoin circulating supply – 19.2 million
- Bitcoin total supply – 19.2 million
- Bitcoin Coinmarketcap ranking – #1
BTC/USD Long-term Trend: Ranging (Daily Chart)
Key levels:
Resistance Levels: $20,000, $22,000, $24,000
Support Levels: $14,000, $12,000, $10,000
BTC/USD range-bounds with the selling pressure seen around the $16,622 level which is stopping it from seeing any major gains. Meanwhile, traders are not surprised by the selling pressure as bears are trying to defend against a break above the 9-day and 21-day moving averages. However, until bulls keep the price above this barrier, the king coin may continue to face a prolonged sideways.
Bitcoin Price Prediction: Bitcoin May Drop Slightly
The Bitcoin price may remain below the 9-day and 21-day moving averages as the daily chart shows; however, a further retracement seems imminent, and it is likely to break below $16,000. Meanwhile, $14,000, $12,000, and $10,000 serve as the major support levels. The technical indicator Relative Strength Index (14) is likely to slide below 40-level, suggesting a bearish movement.
However, as the daily chart reveals, if the bulls could push the price back above the daily high at $16,967, BTC/USD may see a potential resistance level at $17,000, therefore, any further movement towards the upper boundary of the channel could send it to other resistance levels at $20,000, $22,000, and $24,000 respectively.
BTC/USD Medium-term Trend: Ranging (4H Chart)
Looking at the 4-hour chart, the bears are likely to come into the market as the market price stays below the 9-day and 21-day moving averages. The bulls failed to hold the Bitcoin price above the upper boundary of the channel. Meanwhile, if BTC/USD breaks above the channel, $17,500 and above may come into play.
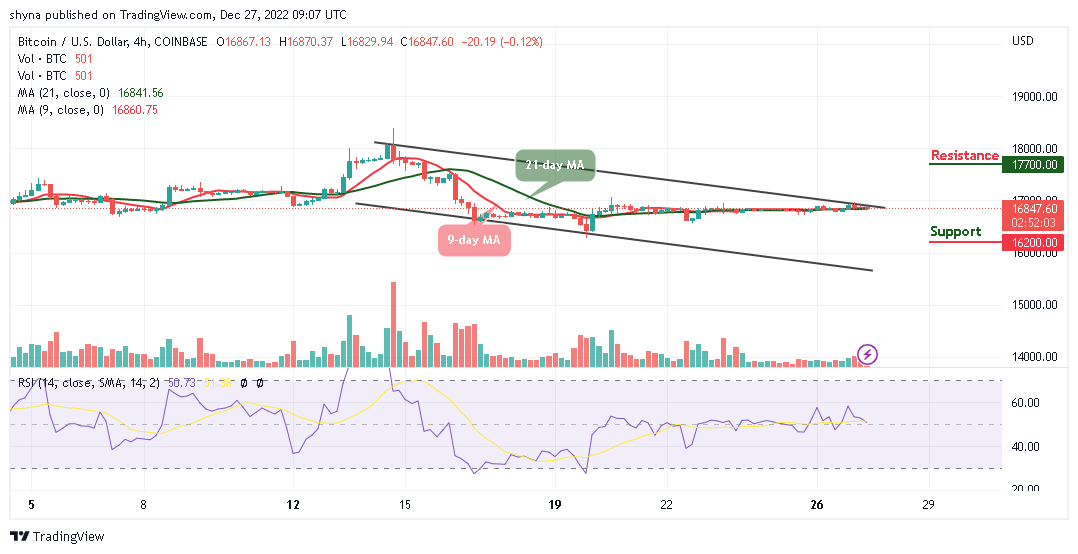
However, if the price breaks towards the lower boundary of the channel, the support level of $16,000 and below may be in focus. Meanwhile, as the Relative Strength Index (14) nosedives below the 40-level, more bearish signals may play out before a rebound could come in.
Dash 2 Trade gives you the ability to optimize your trading and speculative profitability with effective crypto trading recommendations, auto trading, and analytics features. There is a D2T token presale ongoing and time is running out. The presale dashboard launch is coming soon since the product dev is ahead of the schedule. So far, the presale has raised almost $12 million.
Related
- D2T Price Prediction
- How to Buy D2T
Join Our Telegram channel to stay up to date on breaking news coverage
