
Join Our Telegram channel to stay up to date on breaking news coverage
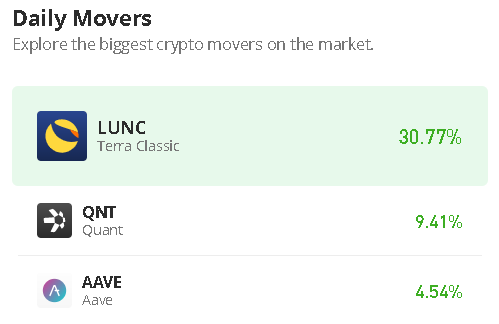
Aave Price Prediction Statistics Data:
- Aave price now – $57.23
- Aave market cap – $775.7 million
- Aave circulating supply – 14 million
- Aave Coinmarketcap ranking – #44
AAVE/USD Market
Key Levels:
Resistance levels: $80, $90, $100
Support levels: $40, $30, $20
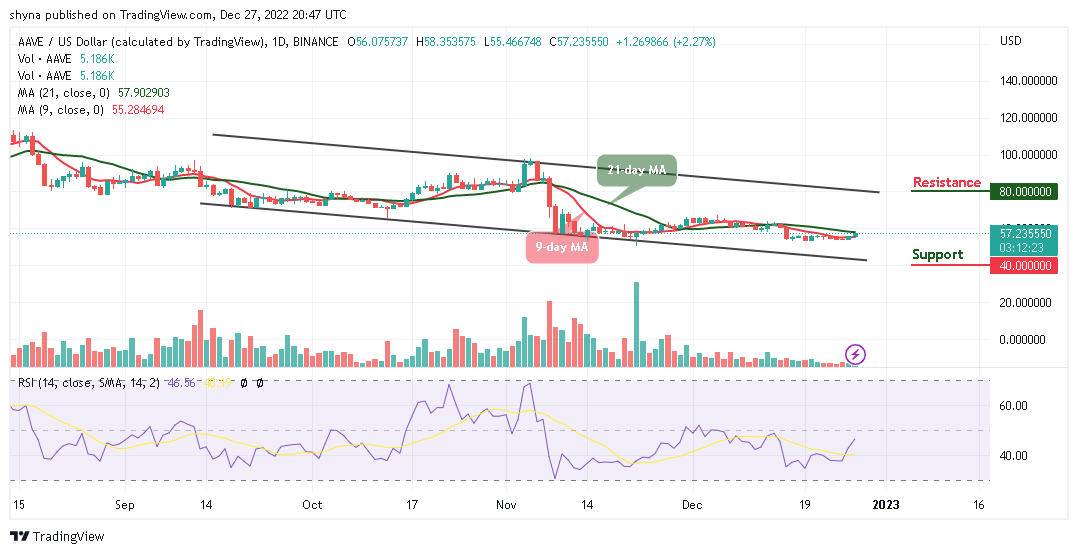
AAVE/USD is likely to cross above the 21-day moving average to increase the bullish movement. Meanwhile, the cryptocurrency might kick-start another bullish run back above $60 if the Aave price moves toward the upper boundary of the channel. Meanwhile, any positive break above the 21-day MA is the first signal needed for the buyers to press higher. Nevertheless, AAVE/USD has to break to the upside before hitting the $60 resistance level.
Aave Price Prediction: Aave (AAVE) Trades Positively
The Aave price is currently hovering within the 9-day and 21-day moving averages. If the buyers begin to grind higher, the first resistance level may come at $60 as this could also be followed by $70. However, additional resistance levels can then be found at $80, $90, and $100. On the other side, if the Aave price slides and head towards the lower boundary of the channel, it could hit the first support level at $50.
However, crossing below the lower boundary of the channel may lead to the critical support levels at $40, $30, and $20 respectively. The technical indicator Relative Strength Index (14) is moving to cross above the 50-level, which indicates that buyers may begin to gain control of the market, and this, could also mean that another signal of AAVE could be pushing towards the resistance level of $70 soon.
Against Bitcoin, the daily chart shows that the Aave price is attempting to stay above the 9-day and 21-day moving averages. As soon as the price stables above this barrier, there is a possibility that additional gains could be obtained. Therefore, the next resistance level is close to the 3600 SAT level. If the price keeps rising, it could even break the 4000 SAT and above.
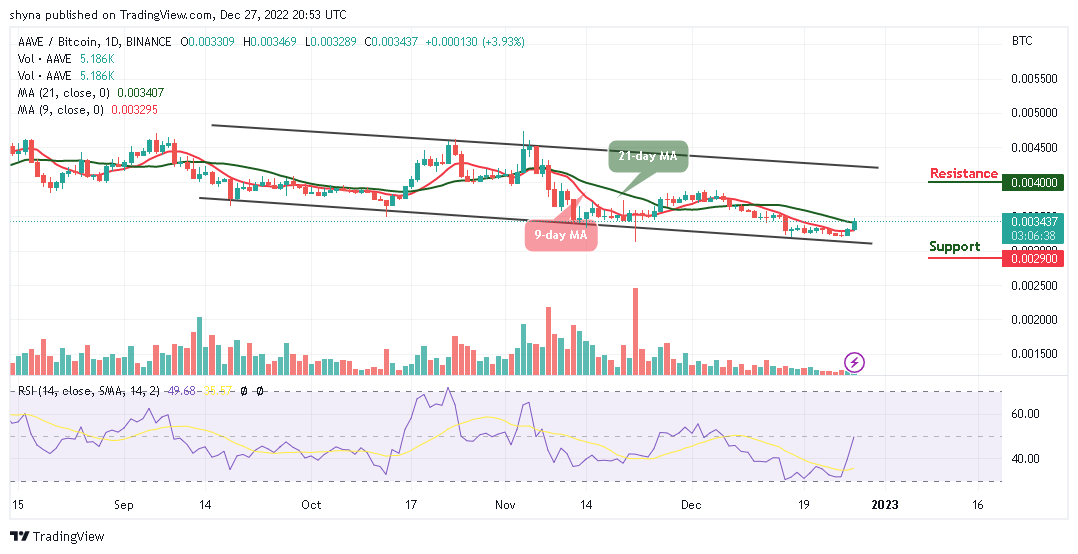
However, if the bears regroup and slide below the 9-day and 21-day moving averages, 3200 SAT support may play out before rolling to the critical support at 2900 SAT and below. Meanwhile, the Relative Strength Index (14) is moving to cross above the 50-level, suggesting bullish movement.
Dash 2 Trade gives you the ability to optimize your trading and speculative profitability with effective crypto trading recommendations, auto trading, and analytics features. There is a D2T token presale ongoing and time is running out. The presale dashboard launch is coming soon since the product dev is ahead of the schedule. So far, the presale has raised almost $12 million.
Related
- D2T Price Prediction
- How to Buy D2T
Join Our Telegram channel to stay up to date on breaking news coverage