Join Our Telegram channel to stay up to date on breaking news coverage
BCH Price Prediction – December 7
At the moment, BCH/USD is seen dropping over 0.63% within 24 hours as it trades at the $284 level.
BCH/USD Market
Key levels:
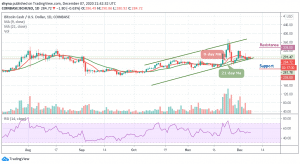
Resistance Levels: $335, $355, $375
Support Levels: $235, $215, $195

The daily chart reveals that BCH/USD has not been able to break the 9-day and 21-day moving averages with the current consolidation pattern as it fails to close above the $290 level. The Bitcoin Cash started the day off by trending lower toward the $280 level inside the channel. Similarly, the first level of support is located below the lower boundary of the channel. Beneath this, support lies at $235, $215, and $195 levels.
What is the Next Direction for BCH?
Today marks another day that BCH/USD has failed to break above moving averages as it looks to set up another few days of negative price declines beneath $280. A break above this channel may set BCH price up to reach the $325 level; however, the market is currently looking less with a failed breakout attempt as the technical indicator RSI (14) moves below 52-level.
Moreover, traders can clearly see Bitcoin Cash fails to keep the upward movement as it couldn’t go higher but may drop beneath the channel in the negative moves. Although the candle is still yet to close, however, it does look unlikely that bulls may end up closing above the moving averages should in case the technical indicator moves above the 55-level. More so, toward the upside, resistance lies at $335, $355, and $375.
Against Bitcoin, bears are now coming back into the market while bulls have not been able to push the price above the moving averages. Nevertheless, the 0.012 BTC and below may come into play if the bearish momentum increases in the markets.
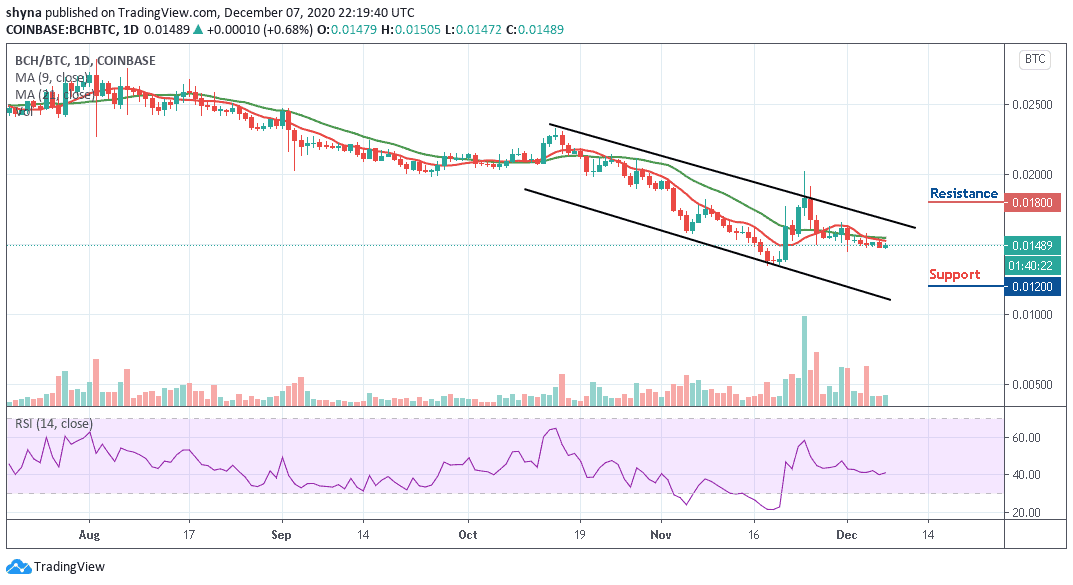
However, if the buyers hijack the current movement and power the market, traders may expect a retest at the 0.016 BTC resistance level; breaking this level may further push the price above the upper boundary of the channel which may likely cause the coin to hit $0.018 BTC and above. At the moment, the RSI (14) signal line is seen moving sideways which makes the market to be indecisive at the moment.
Join Our Telegram channel to stay up to date on breaking news coverage