Join Our Telegram channel to stay up to date on breaking news coverage
The Bitcoin price prediction indicates bearish momentum as the con fails to cross above the 9-day and 21-day moving averages.
Bitcoin Prediction Statistics Data:
- Bitcoin price now – $16,721
- Bitcoin market cap – $321.7 billion
- Bitcoin circulating supply – 19.2 million
- Bitcoin total supply – 19.2 million
- Bitcoin Coinmarketcap ranking – #1
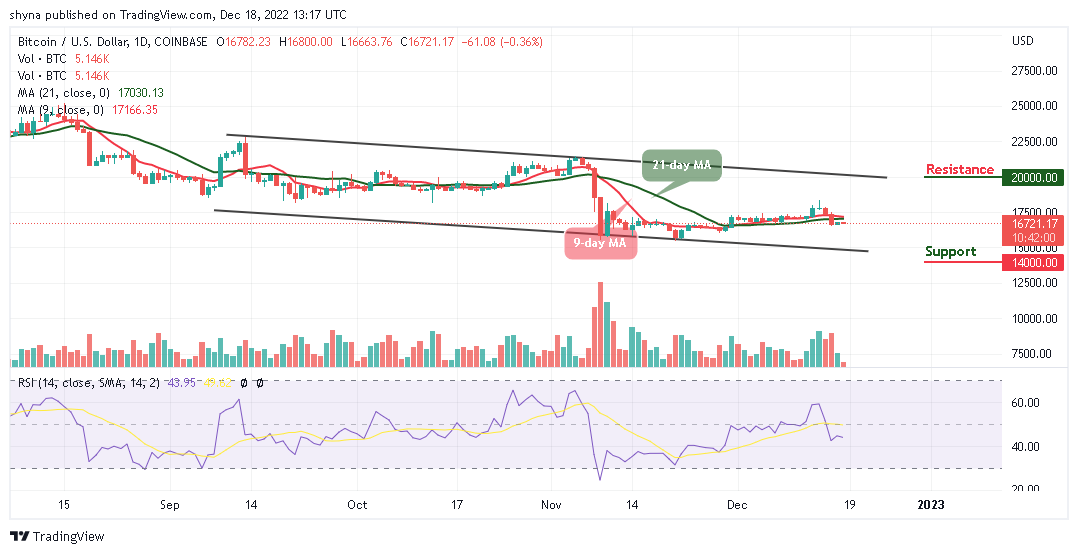
BTC/USD Long-term Trend: Ranging (Daily Chart)
Key levels:
Resistance Levels: $20,000, $22,000, $24,000
Support Levels: $14,000, $12,000, $10,000
BTC/USD is hovering at $16,721 and there have been instances when BTC touches the low of $16,663 to sustain the bearish price action. At the time of writing, the path of least resistance is still downwards, and the daily chart shows that the formation of a bearish may come into focus.
Bitcoin Price Prediction: BTC Fails at Crucial Resistance
At the time of writing, the bulls are struggling in pushing the Bitcoin price above the 9-day and 21-day moving averages as the price remains below the 9-day and 21-day moving averages. BTC/USD has been suffering since the European session as the technical indicator Relative Strength Index (14) remains below the 50-level. This could mean that the King coin is not yet ready for the upside.
On the upside, recovery may not come easy but the coin would have to cross above the moving averages. Meanwhile, a sustainable move above this barrier may locate the resistance level of $18,000, which may allow for an extended recovery toward the potential resistance levels at $20,000, $22,000, and $24,000. Meanwhile, an increase in selling pressure across the market could bring the Bitcoin price towards the supports at $14,000, $12,000, and $10,000.
BTC/USD Medium-term Trend: Ranging (4H Chart)
Bitcoin is trading around the 9-day moving average on the 4-hour chart. However, if the price breaks above the 21-day moving average, it could face the upper boundary of the channel. Meanwhile, higher resistance would be located at the resistance level of $17,000, while the technical indicator Relative Strength Index (14) remains below 40-level, any bullish cross above the channel may cause the king coin may hit the resistance level of $18,000 and above.
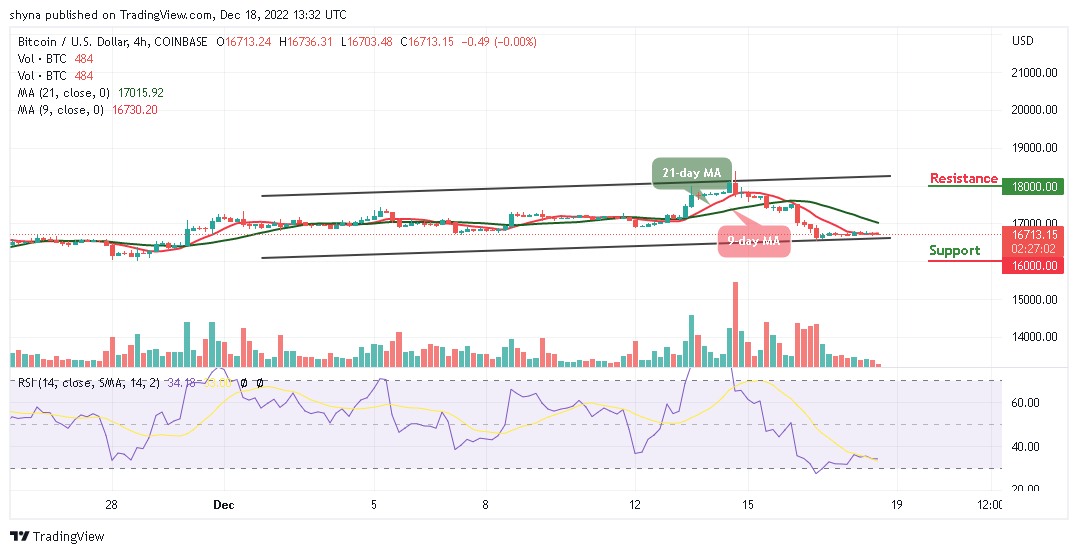
On the other hand, if the bearish movement increases, the support level of $16,500 may not be able to hold the selling pressure, and BTC/USD is likely to fall to the support level of $16,000 and below if the price crosses below the lower boundary of the channel.
Dash 2 Trade gives you the ability to optimize your trading and speculative profitability with effective crypto trading recommendations, auto trading, and analytics features. There is a D2T token presale ongoing and time is running out. The presale dashboard launch is coming soon since the product dev is ahead of the schedule. So far, the presale has raised almost $11 million.
Related
- D2T Price Prediction
- How to Buy D2T
Join Our Telegram channel to stay up to date on breaking news coverage