Join Our Telegram channel to stay up to date on breaking news coverage
The Bitcoin price prediction reveals that BTC is once again falling below $17,000 and could extend the bearish movement to $16,000.
Bitcoin Prediction Statistics Data:
- Bitcoin price now – $16,865
- Bitcoin market cap – $324.5 billion
- Bitcoin circulating supply – 19.2 million
- Bitcoin total supply – 19.2 million
- Bitcoin Coinmarketcap ranking – #1
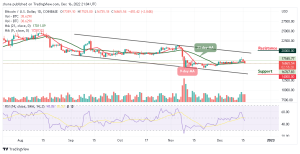
BTC/USD Long-term Trend: Ranging (Daily Chart)
Key levels:
Resistance Levels: $20,000, $22,000, $24,000
Support Levels: $14,000, $12,000, $10,000
BTC/USD failed to clear the resistance level of $18,000 as the king coin corrected lower. At the time of writing, the Bitcoin price is signaling bearish signs and might even start a fresh decline in the coming sessions. However, if the bulls fail to protect the $17,000 support, there is a risk of a major decline. In the stated scenario, the price could decline toward the $16,000 support zone in the near term.
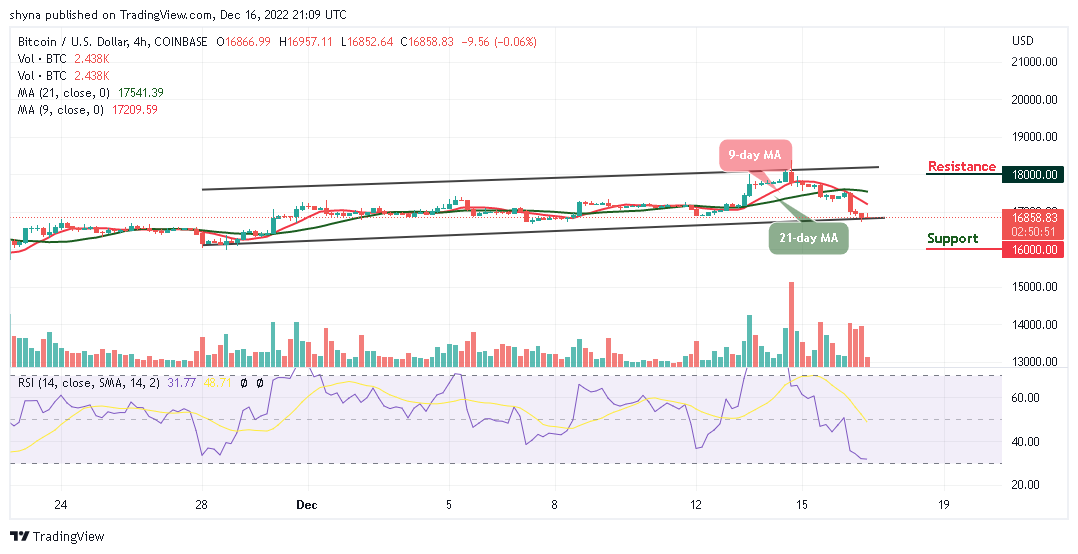
Bitcoin Price Prediction: Bitcoin (BTC) Could Tumble Below $16,000
The Bitcoin price is hovering at $16,865 with an intraday loss of 2.84%. Looking at the daily chart, the prevailing trend is bearish with expanding volatility as the first digital asset may consolidate in a bearish flag pattern. Meanwhile, a breakdown below the 9-day and 21-day moving averages is likely to continue in the direction of the previous trend. In this case, BTC/USD is expected to drop and cross below the lower boundary of the channel to hit the critical support levels at $14,000, $12,000, and $10,000.
However, should the Bitcoin price return above the moving averages; the price could rise toward the nearest resistance at $18,000. A further bullish drive could push the price to $20,000, $22,000, and $24,000 resistance levels. The technical indicator Relative Strength Index (14) is revealing a bearish movement, which shows that the market may continue to drop.
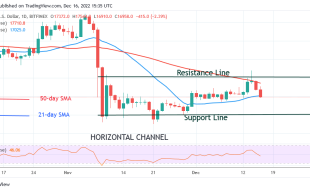
BTC/USD Medium-term Trend: Ranging (4H Chart)
According to the 4-hour chart, the Bitcoin price drops to touch the support level of $16,852 but may likely cross below the lower boundary of the channel to increase the bearish movement. Meanwhile, should the price head to the downside, it could hit the support level of $16,000 and below.
Moreover, if the bulls push the coin above the 9-day and 21-day moving averages, the Bitcoin price could revisit the resistance level of $18,000 and above. At the moment, the market may continue to follow the downtrends or could experience slight uptrends if the Relative Strength Index (14) crosses above the 40-level.
Dash 2 Trade gives you the ability to optimize your trading and speculative profitability with effective crypto trading recommendations, auto trading, and analytics features. There is a D2T token presale ongoing and time is running out. The presale dashboard launch is coming soon since the product dev is ahead of the schedule. So far, the presale has raised almost $10 million.
Related
- D2T Price Prediction
- How to Buy D2T
Join Our Telegram channel to stay up to date on breaking news coverage