Join Our Telegram channel to stay up to date on breaking news coverage
Bitcoin Price Prediction – August 25
There has been a continual keep of specific trading spots in the BTC/USD market operation as the crypto’s price stays in ranges. Yesterday’s session witnessed a low of $21,195.01 and a high of $21,783.08. As of the time of writing, the price rate is at 1.60% positive.
Bitcoin (BTC) Statistics:
BTC price now – $21,675.70
BTC market cap – $414.6 billion
BTC circulating supply – 19.1 million
BTC total supply – 19.1 million
Coinmarketcap ranking – #1
BTC/USD Market
Key Levels:
Resistance levels: $25,000, $27,500, $30,000
Support levels: $20,000, $17,500, $15,000
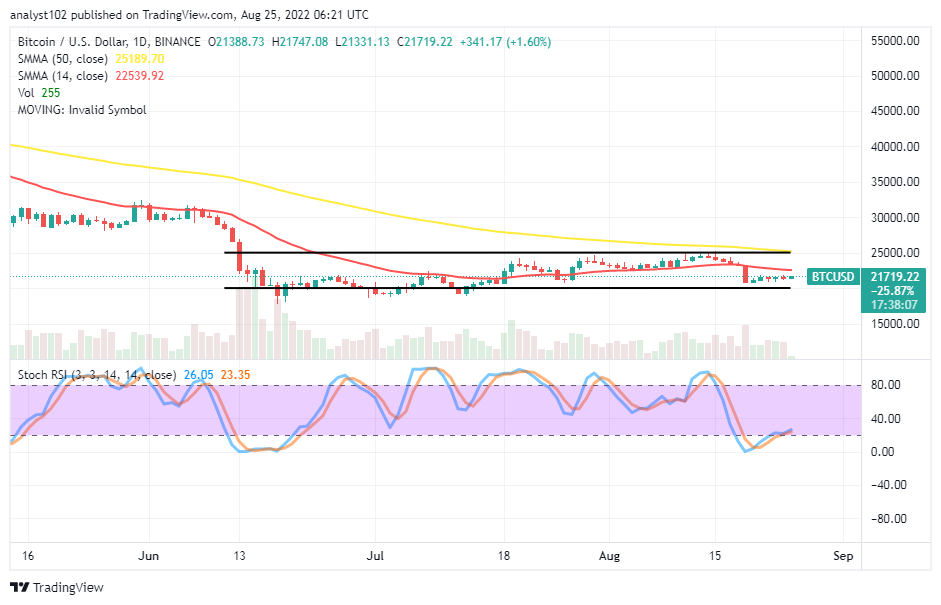
The BTC/USD daily chart showcases the crypto market stays in ranges characterized by the $25,000 and $20,000 levels over several sessions. There have been a series of lower lows carrying a bullish-trading outlook between the space of the lower horizontal line and the trend line of the smaller SMA. The 14-day SMA indicator is at $22,539.92 underneath the $25,189.70. The Stochastic Oscillators have crossed southbound, reaching 26.05 and 23.35 range points.
Your capital is at risk.
Will a sudden breakdown at the psychological $20,000 level of the BTC/USD trade give way to more downs?
Long-position placers to be wary of a sudden breakdown at the psychological $20,000 support level as the BTC/USD market activity stays in ranges near over the value line. Buying habits need to leverage a rebounding motion from the value line while price tends to exhaust forces to the downside. Buyers to be alert to spot active pressures in the upward direction.
On the downside of the technical analysis, as it has indicated by the reading of the 14-day SMA, the near resistance-trading zone to the current condition has been marked at $22,539.92. The market now confines below that value line and the lower support level at $20,000. An aggressive move against the psychological support point will give birth to bears catching on to profiteering.
BTC/USD 4-hour Chart
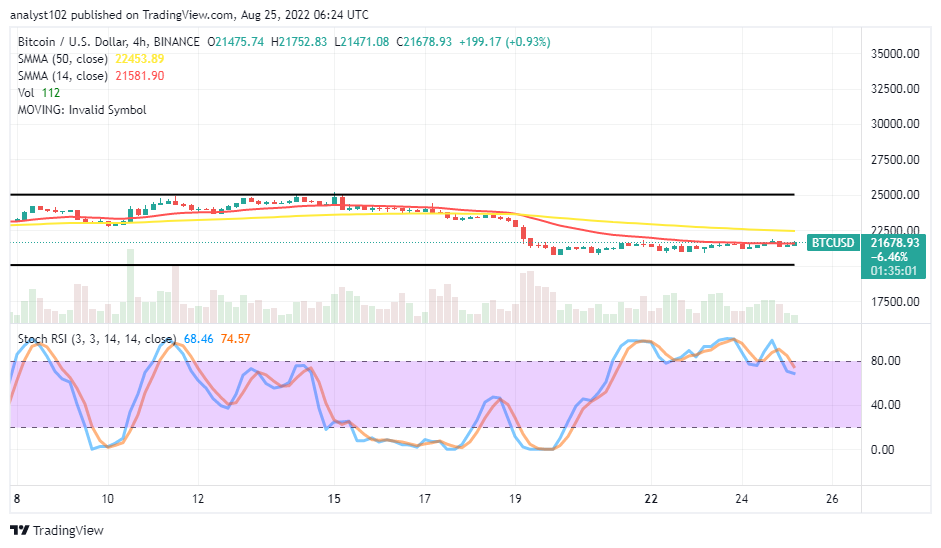
The BTC/USD medium-term chart depicts the crypto-economic market staying in ranges around the trend line of the smaller SMA. The 14-day SMA indicator is at $21,581.90 underneath the $22,453.89 point of the 50-day SMA indicator. And they are in the range-bound spots of $25,000 and $20,000. The stochastic Oscillators are swinging abound some range values involving the overbought region. But, they are at 68.46 and 74.57 range value lines. At this time to obtain more ups, bulls have to consolidate their stances around the 14-day SMA, while a fearful loss of momentum force around it will allow bears to push through some underlying support levels.
Read more:
Join Our Telegram channel to stay up to date on breaking news coverage


