Join Our Telegram channel to stay up to date on breaking news coverage
The Bitcoin price prediction shows that BTC rebounds as the buying interest may increase the bullish movement toward $31,000.
Bitcoin Prediction Statistics Data:
- Bitcoin price now – $30,418
- Bitcoin market cap – $586.6 billion
- Bitcoin circulating supply – 19.3 million
- Bitcoin total supply – 19.3 million
- Bitcoin Coinmarketcap ranking – #1
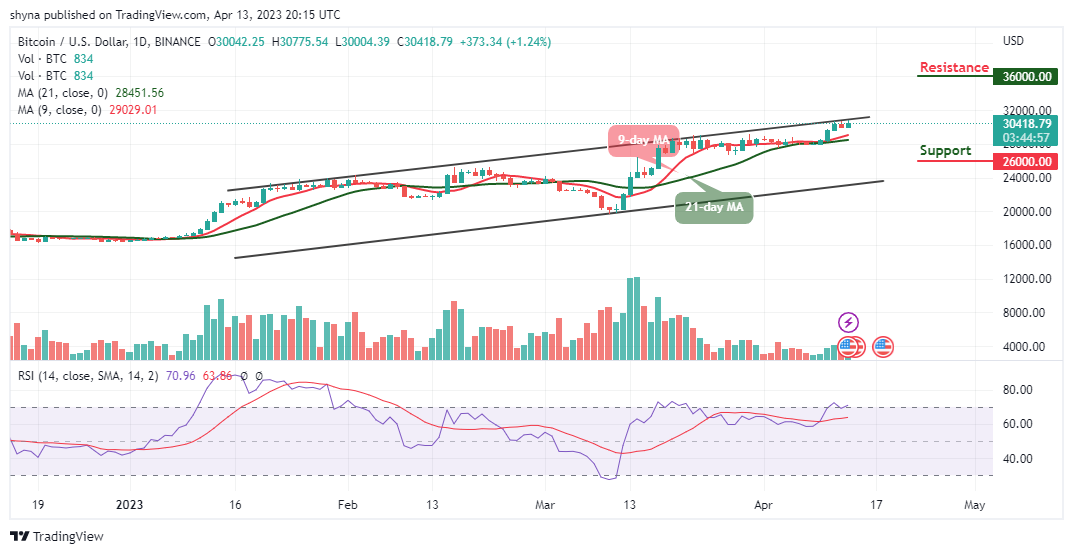
BTC/USD Long-term Trend: Bearish (Daily Chart)
Key levels:
Resistance Levels: $36,000, $38,000, $40,000
Support Levels: $26,000, $24,000, $22,000
BTC/USD may spike above the upper boundary of the channel as the king coin stays above the 9-day and 21-day moving averages. However, as the market establishes a cross above the channel, the buyers may begin to look for additional resistance levels above the daily high of $30,775.
Bitcoin Price Prediction: BTC Price May Hit $31k Resistance
The Bitcoin price is likely to cross above the upper boundary of the channel as the first digital asset targets the resistance level of $31,000. However, the daily chart reveals that in as much as the 9-day moving average remains above the 21-day moving average, this confirms that the coin will create additional gains. On the contrary, BTC/USD may decline if the price breaks below the moving averages but the market price could rise if the $31,000 resistance is reached.
Nonetheless, the technical indicator Relative Strength Index (14) may likely cross into the overbought region to hit the resistance levels of $36,000, $38,000, and $40,000 but any movement toward the lower boundary of the channel could touch the supports at $26,000, $24,000, and $22,000.
BTC/USD Medium-term Trend: Bullish (4H Chart)
According to the 4-hour chart, the Bitcoin price is likely to drop below the 9-day and 21-day moving averages as the technical indicator Relative Strength Index (14) faces the south. However, if the Bitcoin price crosses above the upper boundary of the channel, the bullish influence could spike and the acquired more gains.
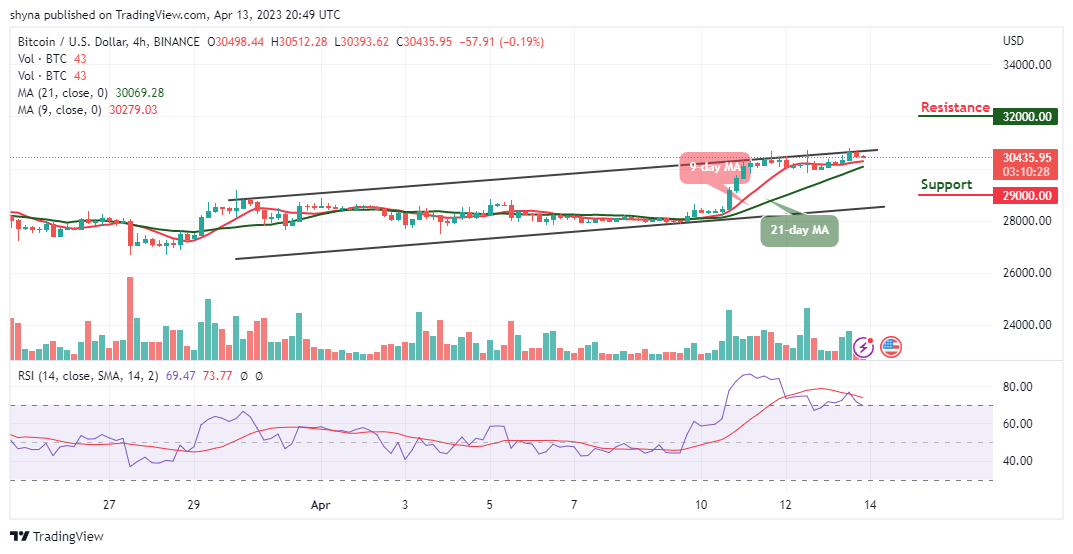
Meanwhile, should the current candle fail to stay above the moving averages, the Bitcoin price may touch the support level of $29,000 and below. Nonetheless, the bulls may need to touch the resistance level of $30,500 to break the potential resistance at $32,000 and above.
Bitcoin Alternatives
The Bitcoin price is trading above the 9-day and 21-day moving averages as the market establishes a slight rise above $30,700 but currently rebounding. However, the bulls may create additional gains if the king coin crosses above the channel. Similarly, meme coin sensation Love Hate Inu has just surpassed the $4m funding milestone during its ongoing presale – all in less than three weeks. This remarkable feat has been achieved thanks to the presale’s enticing token discount, which enables early investors to buy tokens at a lower price than the future exchange listing price.
CoinCodex - Our Recommended Crypto Research Platform

- Live Cryptocurrency Prices for Over 20,000 Coins
- Crypto Price Analysis with Popular Technical Indicators
- Crypto Price Predictions with Short and Long-Term Charts
- Historical Crypto Market Data Dating to 2010
- Crypto Portfolio, Profit Calculator, and Other Investment Tools
Join Our Telegram channel to stay up to date on breaking news coverage