Join Our Telegram channel to stay up to date on breaking news coverage
The Bitcoin price prediction shows that BTC is trading at $30,476 as the coin seems to be preparing for another upward movement.
Bitcoin Prediction Statistics Data:
- Bitcoin price now – $30,476
- Bitcoin market cap – $584.1 billion
- Bitcoin circulating supply – 19.3 million
- Bitcoin total supply – 19.3 million
- Bitcoin Coinmarketcap ranking – #1
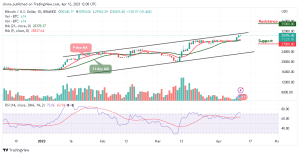
BTC/USD Long-term Trend: Bullish (Daily Chart)
Key levels:
Resistance Levels: $35,000, $37,000, $39,000
Support Levels: $27,000, $25,000, $23,000
BTC/USD is trading above the 9-day and 21-day moving averages at $30,476 as the coin prepares to gain additional higher levels. At the time of writing, the first digital coin is likely to extend toward the resistance level of $31,000 if the bulls put more pressure on the market.
Bitcoin Price Prediction: Bitcoin (BTC) May Cross Above $31,000
The Bitcoin price is heading toward the upside, any further bullish movement above the upper boundary of the channel may locate the potential resistance levels at $35,000, $37,000, and $39,000. Normally, when new uptrends are coming up, traders may use the moving averages to gauge the strength of the trend. Nevertheless, if BTC/USD soars above the upper boundary of the channel, this could be a sign of sustainability and may likely result in a bullish continuation.
Furthermore, if the Bitcoin price fails to move up; traders may see a price cut below the moving averages, and a further low could bring the price to the support levels at $27,000, $25,000, and $23,000 respectively. But as it stands, the Bitcoin price is likely to rise as the technical indicator Relative Strength Index (14) crosses above the overbought region.
BTC/USD Medium-term Trend: Ranging (4H Chart)
However, suppose the bulls push the market above the channel. In that case, traders may expect a retest of the $30,700 resistance level, breaking this level may further push the price towards the resistance level of $32,000 and above as the technical indicator Relative Strength Index (14) remains within the overbought region, which is suggesting a bullish signal.
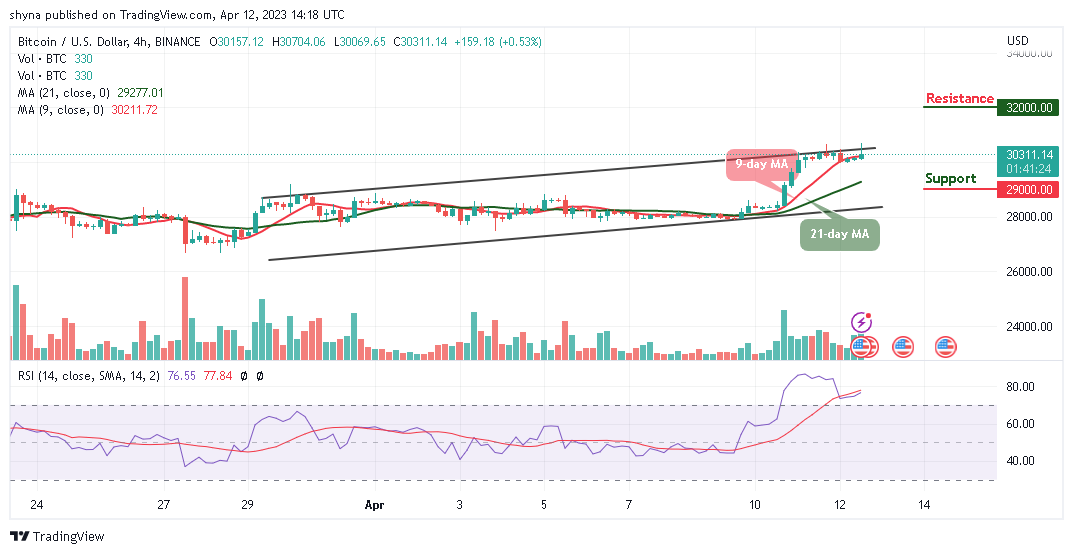
On the contrary, if the king coin slides below the 9-day and 21-day moving averages and heads toward the lower boundary of the channel, it could locate the support level of $29,000 and below.
Alternatives to Bitcoin
The Bitcoin price is currently trading around $30,476 with a 0.46% gain above the 9-day and 21-day moving averages. The Bitcoin price may fight to stay above the important level of $31,000 as it could move to cross above the upper boundary of the channel. On that note, Love Hate Inu (LHINU) is a fast-rising meme coin project set to revolutionalize the $3 billion online survey industry with its utility vote-to-earn (V2E) Web3 technology. The crypto project allows participants to earn rewards for engaging in polls and surveys in a thrilling and unique way as close to $4m has been raised in the ongoing presale.
Join Our Telegram channel to stay up to date on breaking news coverage