Join Our Telegram channel to stay up to date on breaking news coverage
The Bitcoin price prediction shows that BTC is rising for the third straight bullish day as the technical indicator faces the north.
Bitcoin Prediction Statistics Data:
- Bitcoin price now – $29,118
- Bitcoin market cap – $563.7 billion
- Bitcoin circulating supply – 19.3 million
- Bitcoin total supply – 19.3 million
- Bitcoin Coinmarketcap ranking – #1
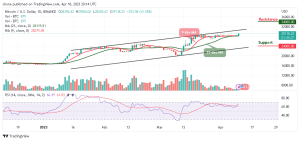
BTC/USD Long-term Trend: Ranging (Daily Chart)
Key levels:
Resistance Levels: $34,000, $36,000, $38,000
Support Levels: $24,000, $22,000, $20,000
BTC/USD is seen pushing the market price above the potential resistance level of $29,000 as bulls need to keep the price above the 9-day and 21-day moving averages. However, the first digital asset may now move with strong bullish momentum after a sustainable break above an important technical level.
Bitcoin Price Prediction: Would BTC Stay Above $29k Level?
At the moment, the technical indicator Relative Strength Index (14) is about to cross above the upper boundary of the channel as bulls push the Bitcoin price toward the upper boundary of the channel. Meanwhile, for the past few weeks, the Bitcoin price seems to be struggling within the moving averages, suggesting that BTC/USD may trade bearishly before attempting to break higher again.
On the upside, the $30,000 level aligns with the initial resistance. A daily close above this resistance level could lift the price to $34,000, $36,000, and $38,000. In other words, Bitcoin could retreat below the moving averages, currently located at $29,118. However, if it breaks below $28,000, the critical supports may be located at $24,000, $22,000, and $20,000 respectively.
BTC/USD Medium-term Trend: Ranging (4H Chart)
According to the 4-hour chart, BTC/USD is currently trading above the 9-day and 21-day moving averages as the coin crosses above the upper boundary of the channel, which could hit the resistance level of $30,000 and above. But the Bitcoin market is likely to range-bound around the upper boundary of the channel, but the buyers must keep the position intact
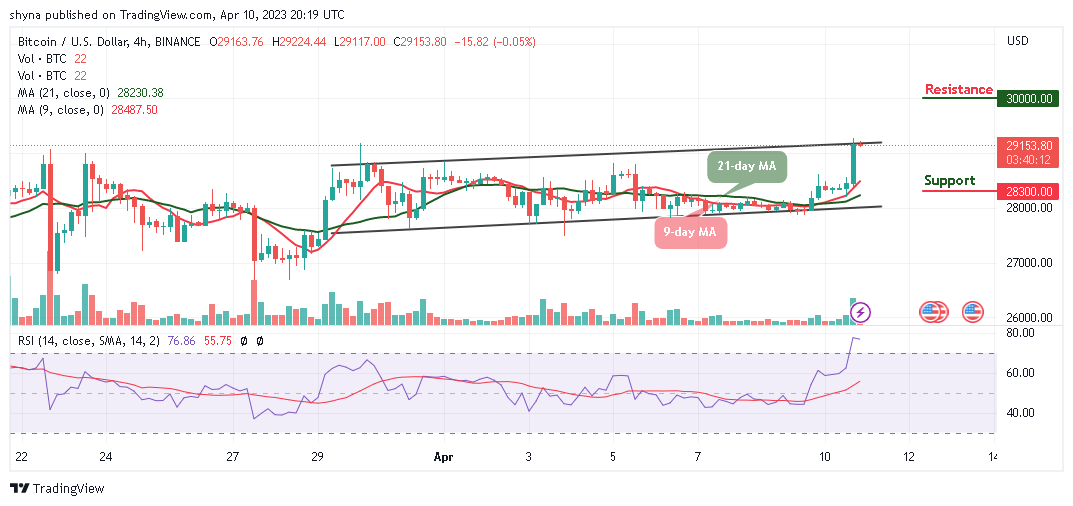
Looking at the Relative Strength Index (14) shows that the BTC price may be ready for the upside as its price spikes to the north. On the contrary, if the coin decides to cross below the 9-day and 21-day moving averages, the support level of $28,300 and below may be located.
Bitcoin Alternatives
The Bitcoin price may continue to follow the bullish movement with a tremendous increase above the moving averages. Meanwhile, at the beginning of today’s trading, the Bitcoin price sees a steady rise above the long-awaited $29,000 resistance. On that note, the Love Hate Inu platform maintains the fundamental principle of decentralization by protecting voters’ identities as this makes it easy to join the community, buy tokens, stake LHINU, and vote on topics. Therefore, the token is doing well in the presale as close to $3.5 million has been raised so far.
Join Our Telegram channel to stay up to date on breaking news coverage