Join Our Telegram channel to stay up to date on breaking news coverage
The Bitcoin price prediction indicates sideways movement as further upside has been rejected severally after touching the daily high at $28,500.
Bitcoin Prediction Statistics Data:
- Bitcoin price now – $28,365
- Bitcoin market cap – $547.2 billion
- Bitcoin circulating supply – 19.3 million
- Bitcoin total supply – 19.3 million
- Bitcoin Coinmarketcap ranking – #1
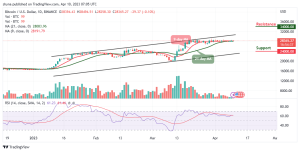
BTC/USD Long-term Trend: Ranging (Daily Chart)
Key levels:
Resistance Levels: $34,000, $36,000, $38,000
Support Levels: $24,000, $22,000, $20,000
BTC/USD is currently hovering at $28,365 as the king coin moves in the same direction above the 9-day and 21-day moving averages. At the time of writing, the path of least resistance is still ranging, and the daily chart shows that the formation of a bearish may likely come to play.
Bitcoin Price Prediction: BTC Price May Slide to Regain the Upside
According to the daily chart, the Bitcoin price is heading to the east as the king coin is yet to break below the 9-day and 21-day moving averages. Despite the current market movement, the Relative Strength Index (14) is yet to cross below the 60-level. This could mean that there may still be room that could be explored by the bulls as the Bitcoin price may reclaim back the resistance level of $29,000.
Looking at the upside, the daily chart reveals that the recovery may need to come slowly as the support will have to be sorted for above the channel. Meanwhile, a sustainable move above this barrier could be located at $32,000, which may allow for an extended recovery toward the resistance levels at $34,000, $36,000, and $38,000. In the meantime, a bearish cross below the moving averages could force the Bitcoin price to hit the supports at $24,000, $22,000, and $20,000.
BTC/USD Medium-term Trend: Ranging (4H Chart)
On the 4-hour chart, the Bitcoin price is seen trading above the 9-day and 21-day moving averages, the coin has just survived the $28,000 support as the market is trying to recover from the bearish momentum. However, BTC/USD is likely to return to the bull market if the price breaks above the upper boundary of the channel.
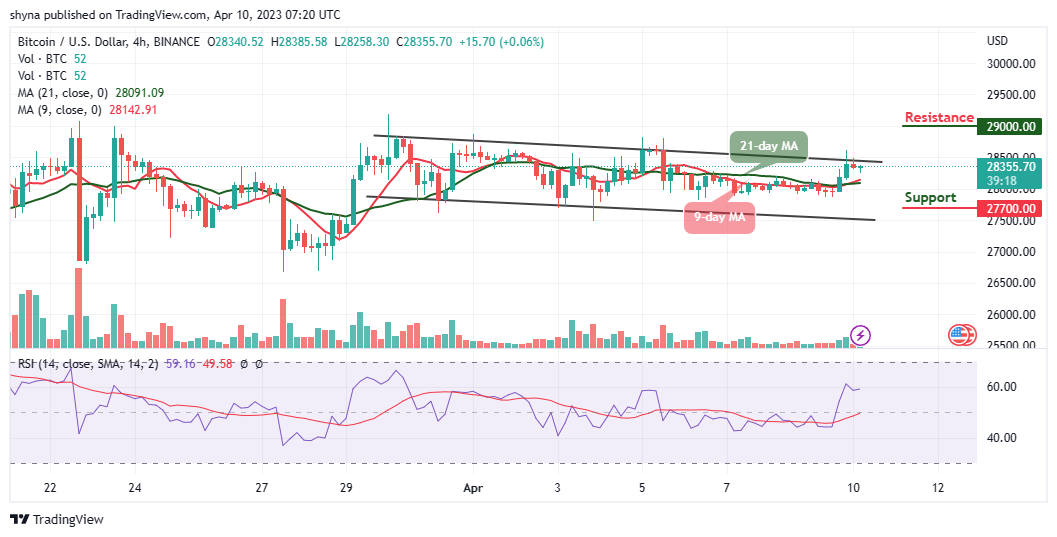
Meanwhile, higher resistance could be located at $29,000 and above as the technical indicator Relative Strength Index (14) moves to cross above the 60-level to confirm the bullish movement. On the other hand, if the bearish movement resumes, the support level of $27,700 and below could be reached and the king coin may face the lower boundary of the channel.
Alternatives to Bitcoin
The Bitcoin price is seen hovering around $28,365, with the current consolidation pattern, the king coin is yet to cross below the moving averages and any bullish movement toward the upper boundary of the channel could hit the nearest resistance level of $29,000. However, if you have ever enjoyed participating in polls and sharing your opinions, the Love Hate Inu token is the perfect project for you to invest in. Don’t miss your chance to be a part of the growing community as close to $3.5 million has been raised in the ongoing presale.
Join Our Telegram channel to stay up to date on breaking news coverage