Join Our Telegram channel to stay up to date on breaking news coverage
The Bitcoin price prediction sees a 0.42% decline over the past few hours as the cryptocurrency fails at $28,218 and heads lower.
Bitcoin Prediction Statistics Data:
- Bitcoin price now – $28,036
- Bitcoin market cap – $540 billion
- Bitcoin circulating supply – 19.3 million
- Bitcoin total supply – 19.3 million
- Bitcoin Coinmarketcap ranking – #1
BTC/USD Long-term Trend: Bullish (Daily Chart)
Key levels:
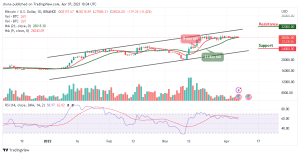
Resistance Levels: $32,000, $34,000, $36,000
Support Levels: $24,000, $22,000, $20,000
BTC/USD loses its momentum after touching key resistance above $28,218. As of writing, the king coin is down 0.42% on the day at $28,036 within the 9-day and 21-day moving averages. Meanwhile, the Bitcoin price may likely struggle to stay above $28,000, and if it does, it should be free to rise well above $29,000 if it moves in the next positive direction.
Bitcoin Price Prediction: Can Bitcoin Price Trade Above $29k?
After a slightly positive move above $28,200, the Bitcoin price is likely to slide below the 9-day and 21-day moving averages. Over the past few days, the king coin has been struggling to remain above the moving averages. In today’s session, the Bitcoin price attempted to push higher toward the upper boundary of the channel, but the sellers stepped into the market to bring the king coin lower to touch the daily low of $27,888.
Moreover, if the coin moves much lower, the $27,000 may serve as the nearest support level, which may likely make room for the coin to fall further to hit the supports at $24,000, $22,000, and $20,000. The Relative Strength Index (14) keeps moving around the 60-level, crossing below this level may cause the king coin to have a continuous downward movement. On the contrary, BTC/USD may likely see resistance levels of $24,000, $22,000, and 20,000 if it finds its way above the upper boundary of the channel.
BTC/USD Medium-term Trend: Ranging (4H Chart)
On the 4-Hour chart, the BTC price hovers around $28,064 and could take time to cross above the 9-day and 21-day moving averages. However, if the bulls gather enough strength, the upward movement may be near the resistance level of $29,000 and above.

On the downside, immediate support could be located around the $27,500 level while critical support is at $27,000 and below. Therefore, the Bitcoin price may likely fall below the lower boundary of the channel if the bears put more pressure on the market, Moreover, the Relative Strength Index (14) is likely to cross above the 50-level, suggesting a bullish movement.
Bitcoin Alternatives
The Bitcoin price is likely to follow a bullish movement as the king coin may begin an increase above the 9-day and 21-day moving averages. Meanwhile, if the resistance level of $28,218 fails to hold, it may reverse and face the support level of $27,000, further increase in the bears’ pressure may bring down the price below the moving averages. Nonetheless, Love Hate Inu distinguishes itself from other meme coins due to its versatile accurate survey and poll results powered by the Ethereum blockchain – giving it a real-life utility beneficial to the global industry as almost $3.5 has been raised in the ongoing presale.
Join Our Telegram channel to stay up to date on breaking news coverage