
Join Our Telegram channel to stay up to date on breaking news coverage
The Bitcoin price prediction shows that BTC keeps following the sideways movement as the king coin fails to cross above the channel.
Bitcoin Prediction Statistics Data:
- Bitcoin price now – $28,607
- Bitcoin market cap – $544.2 billion
- Bitcoin circulating supply – 19.3 million
- Bitcoin total supply – 19.3 million
- Bitcoin Coinmarketcap ranking – #1
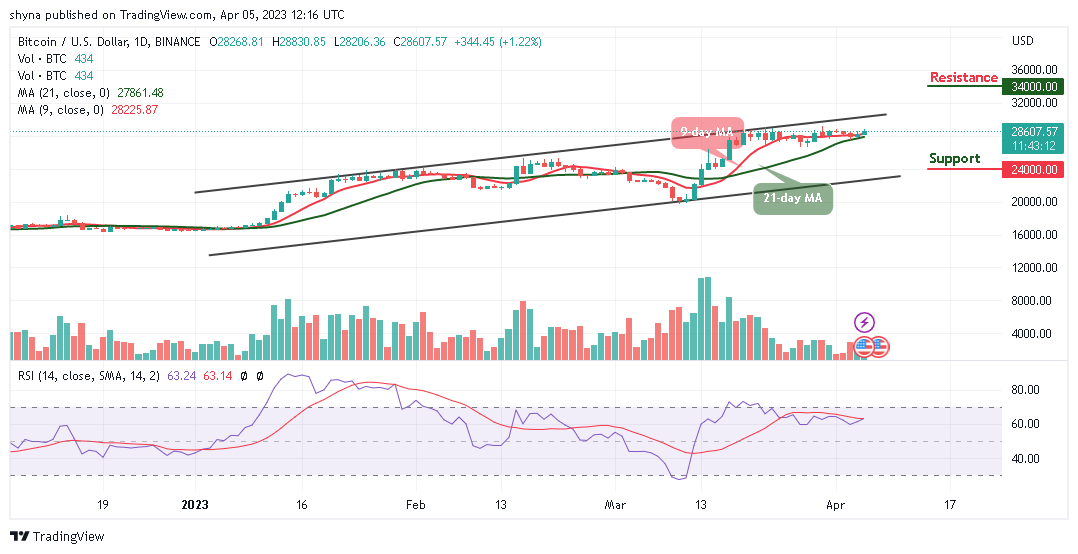
BTC/USD Long-term Trend: Bullish (Daily Chart)
Key levels:
Resistance Levels: $34,000, $36,000, $38,000
Support Levels: $24,000, $22,000, $20,000
The Bitcoin price is bound for a spike in volatility, but there seems to be no room for further losses after fluctuating in the past few days. BTC/USD is hovering at $28,607 above the 9-day and 21-day moving averages.
Bitcoin Price Prediction: BTC Price May Consolidate Before the Next Action
The Bitcoin price might see further sideways price action as additional losses could play out until there is a change in the price movement. However, as the Bitcoin price ranges, the coin could rise and cross the upper boundary of the channel. On that note, the technical indicator Relative Strength Index (14) keeps moving above the 60-level, this could mean that the king coin may be ready for the upside.
Looking at it from above, recovery could be set in bit by bit as the bulls may push the Bitcoin price above the resistance level of $29,000, and a sustainable movement above the channel could allow for an extended recovery in the direction of the potential resistance levels at $34,000, $36,000, and $38,000. On the downside, any bearish movement below the 9-day and 21-day moving averages may locate the supports at $24,000, $22,000, and $20,000.
BTC/USD Medium-term Trend: Ranging (4H Chart)
Looking at the 4-hour chart, the Bitcoin price is hovering within the 9-day and 21-day moving averages. Meanwhile, BTC/USD may head toward the upper boundary of the channel as the market could recover from the bearish momentum. However, if the price crosses above the channel, it could locate the resistance level at $29,500 and above.
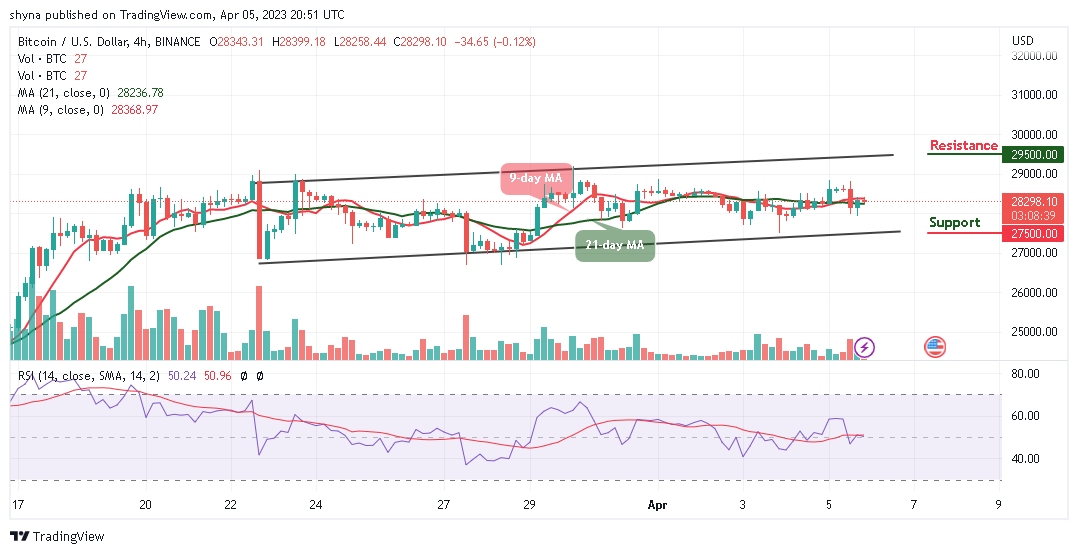
Moreover, if the bearish movement steps back, the Bitcoin price is likely to cross below the lower boundary of the channel and could touch the support level of $27,500 and below. Nevertheless, the technical indicator Relative Strength Index (14) remains above the 50-level, suggesting sideways movement.
Alternatives to Bitcoin
The Bitcoin price regains back towards the upper boundary of the channel because any movement to the downside may bring the coin back to the support level of $27k. On the upside, a sustained move above the channel could make the king coin create additional gains. However, Love Hate Inu is on the right part to becoming the fastest crypto project to raise the highest capital in the presale stage, which is usually a sign of a bullish asset. Therefore, the LHINU token has raised almost $3.5 million since its official presale launch, showing huge excitement from investors.
Join Our Telegram channel to stay up to date on breaking news coverage