Join Our Telegram channel to stay up to date on breaking news coverage
The Bitcoin price prediction shows that BTC is retracing above $28,000, and the coin must remain above $28,500 to continue higher.
Bitcoin Prediction Statistics Data:
- Bitcoin price now – $28,149
- Bitcoin market cap – $541.9 billion
- Bitcoin circulating supply – 19.3 million
- Bitcoin total supply – 19.3 million
- Bitcoin Coinmarketcap ranking – #1
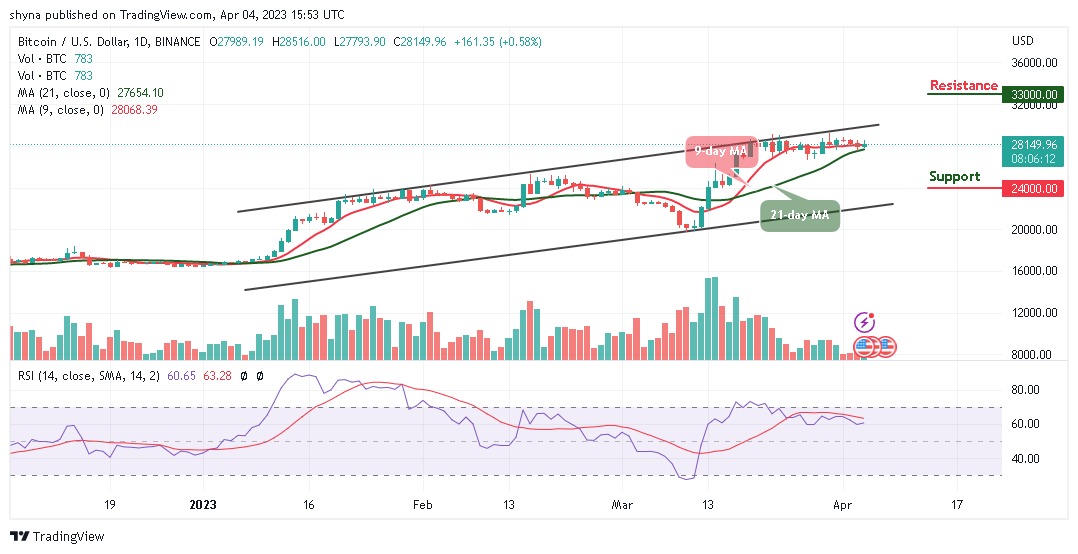
BTC/USD Long-term Trend: Ranging (Daily Chart)
Key levels:
Resistance Levels: $33,000, $35,000, $37,000
Support Levels: $24,000, $22,000, $20,000
BTC/USD bulls may slowly come back into action after a minor battering from the bears. If this happens, the expectation of recovery could turn out to be true. Today, BTC/USD touches the daily high at $28,519 after soaring from $27,793. The king coin then pulled back to where it is trading currently and may head downwards if the bears step back into the market.
Bitcoin Price Prediction: BTC Could Move Sideways
The Bitcoin price is deciding around $28,149 above the 9-day and 21-day moving averages, where the buyers and sellers are anticipating a clear breakout or breakdown. Meanwhile, the $29,000 and $29,500 levels may further surface as the key resistances should the $28,500 level holds. However, a strong bullish spike may take the price to $33,000, $35,000, and $37,000 levels.
Moreover, if the market makes a quick turn to the south, the BTC/USD price may drop to $27,000, and should this support fails to contain the sell-off; traders may see a further rollback to $24,000, $22,000, and critical $20,000. Meanwhile, the technical indicator Relative Strength Index (14) suggests an upward movement as the signal line keeps moving above the 60-level.
BTC/USD Medium-term Trend: Ranging (4H Chart)
The 4-hour chart for BTC shows that the king coin is still ranging below the 9-day and 21-day moving averages. However, following the recent rebound at $28,104 which is now a key support level, the next key support level could be found at $27,000 and below.
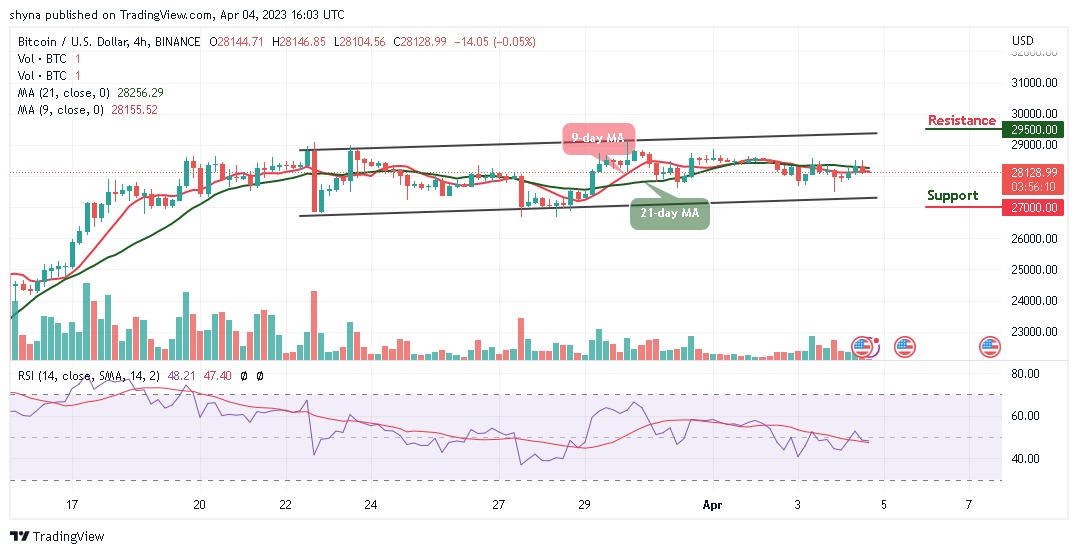
However, considering the recent sharp rebound, the Bitcoin price may re-enter the bullish rally to the $28,500 resistance. A climb above the mentioned resistance may further push the BTC price to the $29,500 resistance level. As it is now, it seems the bears may likely return to the market as the Relative Strength Index (14) is moving below the 50-level and could resume the downward direction.
Bitcoin Alternatives
The Bitcoin price is seen hovering around $28,149, with the current consolidation pattern, the king coin stays above the moving averages and any further bullish movement toward the upper boundary of the channel could hit the nearest resistance level of $29,000. However, if you have ever enjoyed participating in polls and sharing your opinions, LHINU is the perfect project for you to invest in. Don’t miss your chance to be a part of the growing Love Hate Inu community as close to $3.5 million has been raised in the ongoing presale.
Read more:
Join Our Telegram channel to stay up to date on breaking news coverage