Join Our Telegram channel to stay up to date on breaking news coverage
The Bitcoin price prediction shows that BTC indicates sideways movement as the coin fails to head toward the upper boundary of the channel.
Bitcoin Prediction Statistics Data:
- Bitcoin price now – $28,303
- Bitcoin market cap – $545.9 billion
- Bitcoin circulating supply – 19.3 million
- Bitcoin total supply – 19.3 million
- Bitcoin Coinmarketcap ranking – #1
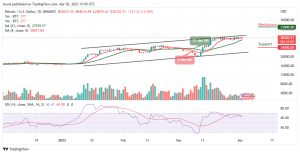
BTC/USD Long-term Trend: Ranging (Daily Chart)
Key levels:
Resistance Levels: $33,000, $35,000, $37,000
Support Levels: $24,000, $22,000, $20,000
BTC/USD is hovering at $28,303 but the king coin has not been able to reclaim the resistance level of $29,000 as the coin consolidates above the 9-day and 21-day moving averages. At the moment, the Bitcoin price may begin to follow the sideways movement, but the daily chart shows that the formation of a bullish movement is likely to play out.
Bitcoin Price Prediction: BTC Price May Consolidates to the Upside
As the Bitcoin price moves toward the east, it is likely to rise and face the upper boundary of the channel as the technical indicator Relative Strength Index (14) moves in the same direction above the 60-level. This could mean that the King coin is ready for the upside as the red line of the 9-day moving average remains above the green line of the 21-day moving average.
Looking at it from above, recovery may set in bit by bit as the bulls could bring the king coin above the resistance level of $29,000. However, a sustainable movement toward the north may reach the resistance level of $31,000, which could allow for an extended recovery in the direction of the potential resistance levels at $33,000, $35,000, and $37,000. On the downside, any bearish movement may cause the Bitcoin price to hit the supports at $24,000, $22,000, and $20,000.
BTC/USD Medium-Term Trend: Ranging (4H Chart)
Looking at the 4-hour chart, the Bitcoin price is moving to cross above the 9-day and 21-day moving averages. BTC/USD may need to cross above the 9-day and 21-day moving average as the market is trying to recover from the bearish momentum. However, if the price crosses above the 9-day moving average, it could locate the resistance level at $30,000 and above.
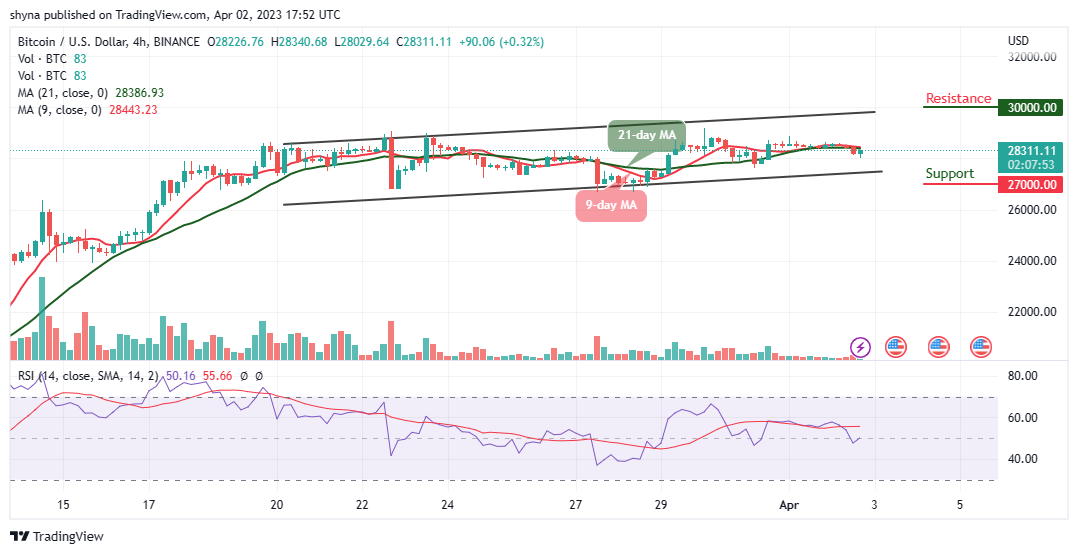
Moreover, if the bearish movement steps back, the support level of $28,000 may not be able to hold the selling pressure. Therefore, BTC/USD is likely to fall to $27,000 and below if the price slides below the lower boundary of the channel. Nevertheless, the technical indicator Relative Strength Index (14) is moving to cross above the 50-level to confirm the bullish movement.
Bitcoin Alternatives
The Bitcoin price is currently trading around $28,303 with a 0.76% loss after touching the daily high at $28,616. The first digital asset may fight to stay above the important level of $28,500 as it could cross above the upper boundary of the channel. However, Love Hate Inu has already raised over $2.5 million since its presale launched. At just $0.000085 per token, LHINU has the potential to be the next big crypto. Through the presale, the token’s price will increase, paving the way for new exchange listings.
Join Our Telegram channel to stay up to date on breaking news coverage