Join Our Telegram channel to stay up to date on breaking news coverage
The Bitcoin price prediction shows that BTC bulls’ comeback is likely to send the price toward the resistance level of $30,000.
Bitcoin Prediction Statistics Data:
- Bitcoin price now – $28,497
- Bitcoin market cap – $549.6 billion
- Bitcoin circulating supply – 19.3 million
- Bitcoin total supply – 19.3 million
- Bitcoin Coinmarketcap ranking – #1
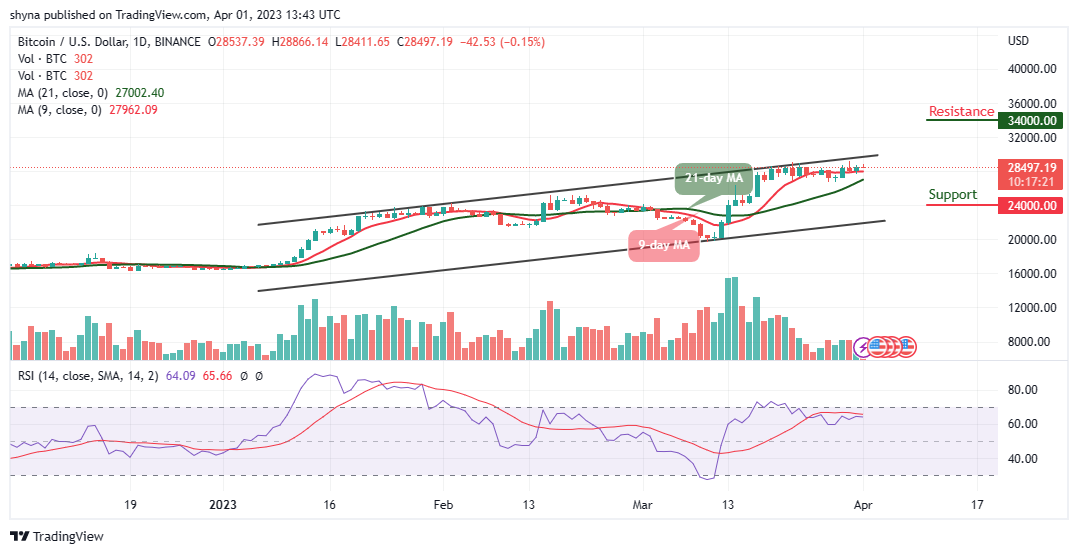
BTC/USD Long-term Trend: Bullish (Daily Chart)
Key levels:
Resistance Levels: $34,000, $36,000, $38,000
Support Levels: $24,000, $22,000, $20,000
The daily chart reveals that BTC/USD keeps trading above $28,000 following a bearish correction. Today, the European session is characterized by a renewed upward trend whereby BTC/USD has recovered from intraday lows at $28,411 to highs around $28,866. Moreover, Bitcoin price is currently hovering 0.15% higher on the day at $28,497 above the 9-day and 21-day moving averages.
Bitcoin Price Prediction: Bitcoin (BTC) Needs to Move Above $29k
At the time of writing, the Bitcoin price is getting ready to cross above the upper boundary of the channel. On a bullish note, the technical indicator, Relative Strength Index (14) shows that the signal line is likely to move back into the overbought region which suggests that the Bitcoin price will once again move towards $30,000, which is the potential resistance level.
On that note, a strong bullish movement above the channel may take the price to the resistance levels of $34,000, $36,000, and $38,000. Meanwhile, if the market makes a quick turn to the south, the BTC/USD may likely drop to $26,000, and should this support fails to contain the sell-off, traders may see a further rollback to $24,000, $22,000, and critical $20,000.
BTC/USD Medium-term Trend: Ranging (4H Chart)
Following the 4-hour chart, Bitcoin (BTC) bulls are now stepping into the market pushing the price above $28,500. Although the Bitcoin price has not yet closed above $9,000, it’s still in the loop of making a reversal. However, the Bitcoin price hovers around $28,517 and may take time to persistently trade above $29,000.
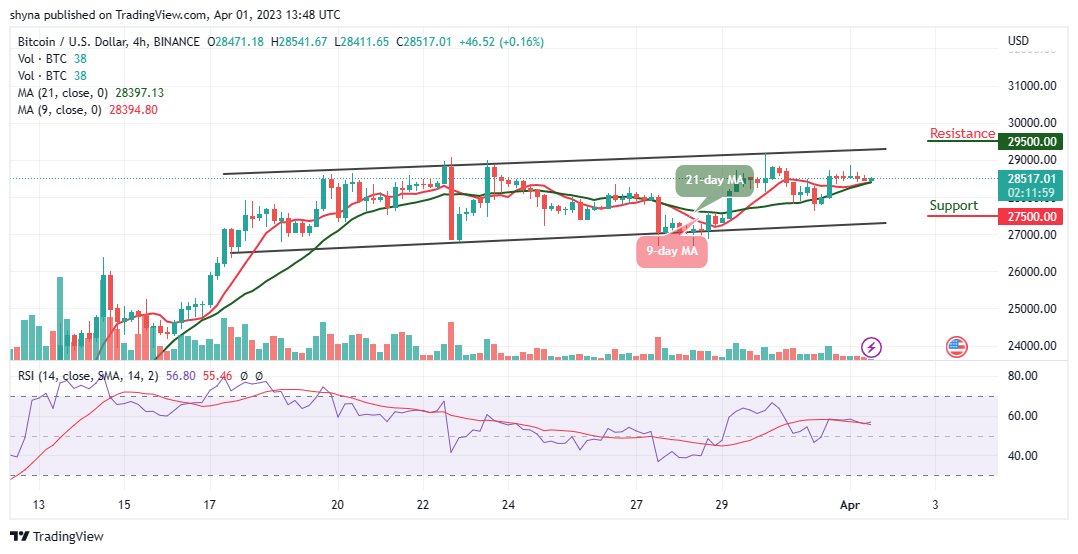
Nevertheless, BTC/USD may keep moving positively above the 9-day and 21-day moving averages. But, according to the technical indicator, the Relative Strength Index (14) could make a bullish cross above the 60-level, the upward movement may likely push the price to the nearest resistance level at $49,500 and above while the immediate support lies at $27,500 and below.
Alternatives to Bitcoin
Since the past few days, the Bitcoin price has been heading toward the north, and in the context of this; an upward movement to hit the resistance level of $30k is expected. Meanwhile, on the downside, if the market decides to fall, the Bitcoin price could fall below the 9-day moving average, and if that barrier fails to hold the sell-off, BTC/USD could see a further declines. However, Love Hate Inu seeks to harness its Ethereum blockchain technology by providing immutable and secure poll and survey results that cannot be manipulated in any form as almost $2.5 million has been raised in the ongoing presale.
Join Our Telegram channel to stay up to date on breaking news coverage