Join Our Telegram channel to stay up to date on breaking news coverage
XRP Price Prediction – March 24
Looking at the daily chart, XRP/USD tried to break above the channel as the price failed to gather enough momentum.
XRP/USD Market
Key Levels:
Resistance levels: $0.62, $0.64, $0.66
Support levels: $0.45, $0.43, $0.41
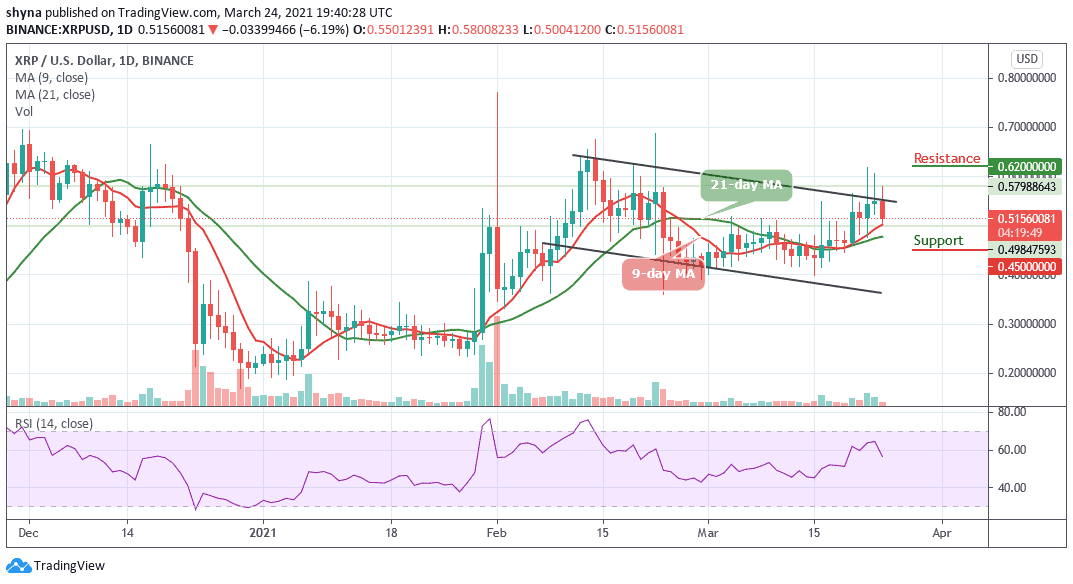
XRP/USD fails to break above the $58 level as the price absorbed stops located below $0.50 and slipped to $0.49 in a matter of minutes. While the coin is making an attempt to recover the losses, the Ripple (XRP) is currently trading at $0.51 with 6.19% losses from the beginning of the day. Meanwhile, XRP/USD needs to regain ground above $0.55 to mitigate the bearish pressure.
What is the Next Direction for Ripple?
XRP/USD is currently changing hands at $0.51, and any attempt to make it trade below the 9-day and 21-day moving averages may open the doors for more downsides and the price could spike below the $0.47 support level. However, traders should keep an eye on the $0.46 before creating a new bearish trend at the support levels of $0.45, $0.43, and $0.41.
For the upside, the buyers may need to make a sustainable move above $0.55 as soon as possible to negate an immediate bearish scenario. More so, for the upside to gain traction, the coin needs to regain ground above $0.60, while $0.62, $0.64, and $0.66 resistance levels are the ultimate aims for the bulls. More so, the technical indicator RSI (14) suggests that the market may likely move bearishly as the signal line slides below 60-level.
Against Bitcoin, the Ripple (XRP) is moving on the downside within the descending channel. If the selling pressure persists, the XRP price variation may likely bring a new low. At the moment, the RSI (14) is moving below 60-level; more negative movements may come to play if the pair crosses below the moving averages.
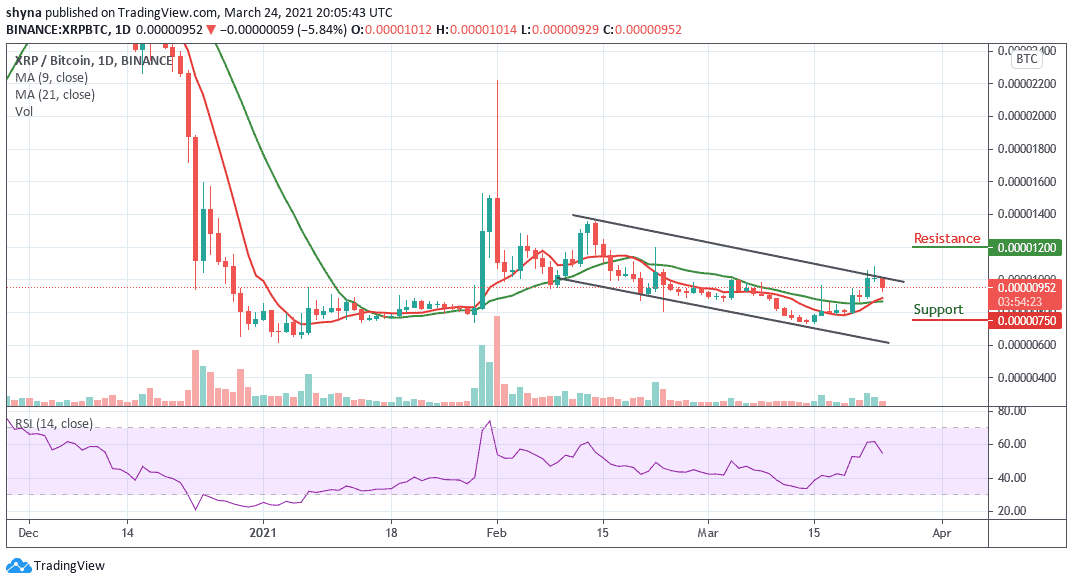
However, traders may expect close support at 800 SAT before breaking to 750 SAT and below. If a bullish movement occurs and validates a break above the upper boundary of the channel; we can then confirm a bull-run for the market and the nearest resistance level is located at 1200 SAT and above.
Join Our Telegram channel to stay up to date on breaking news coverage