Join Our Telegram channel to stay up to date on breaking news coverage
Bitcoin (BTC) Price Prediction – March 12
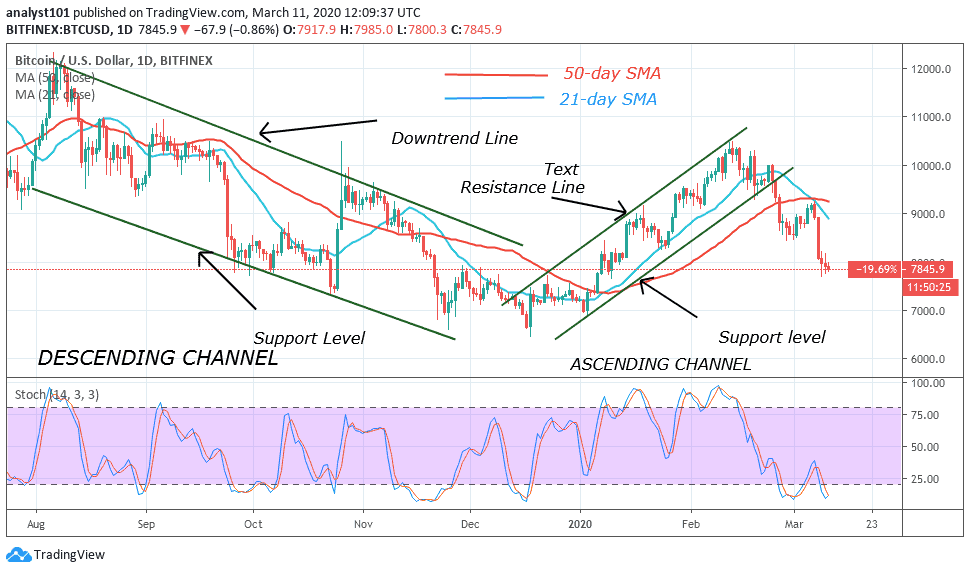
The daily chart reveals that Bitcoin (BTC) aims to fall more as the technical indicator RSI (14) enters into the oversold conditions.
BTC/USD Long-term Trend: Bearish (Daily Chart)
Key levels:
Resistance Levels: $8,700, $8,900, $9,100
Support Levels: $7,000, $6,800, $6,600

The entire crypto markets are pulled into losses as BTC/USD breaks down to test $7,500 support in the early hours of today are trading. Despite the action of reducing the severity by the buyers, selling activities continue to mount amid fears of the deadly disease (coronavirus). Currently, the price of Bitcoin is moving above $7,500 after a shallow recovery from $7,535.14 which is an intraday low for now, following a 4.47% loss on the day.
Meanwhile, the daily chart reveals that the Bitcoin price is declining rapidly and the coin is trading close to the critical support of $7,500, which is down of 4.47% since the beginning of the day. More so, the downside momentum has been gaining traction after the price broke below the 9-day MA on the daily chart. The psychological $7,500 is under threat now and once it is out of the way, the sell-off may be extended towards the support levels of $7,000, $6,800 and $6,600 respectively.
However, the bulls will need to see a sustainable move above $8,500 to mitigate the initial bearish pressure. Should in case the coin manages to recover above this handle, then the upside momentum may gain traction and could take BTC/USD to $8,700, $8,900 and $9,100 resistance levels. The technical picture looks bearish as RSI (14) faces oversold territory pointing downwards, which indicates that the sell-off may continue.
BTC/USD Medium – Term Trend: Bearish (4H Chart)
The 4-hour chart reveals that BTC/USD is falling drastically below the 9-day and 21-day moving averages as the bulls fails to defend the $7,500 support due to the heavy selling pressure in the market. More so, the $7,000, $6,800 and $6,600 may come into play if the price breaks below the lower boundary of the descending channel.
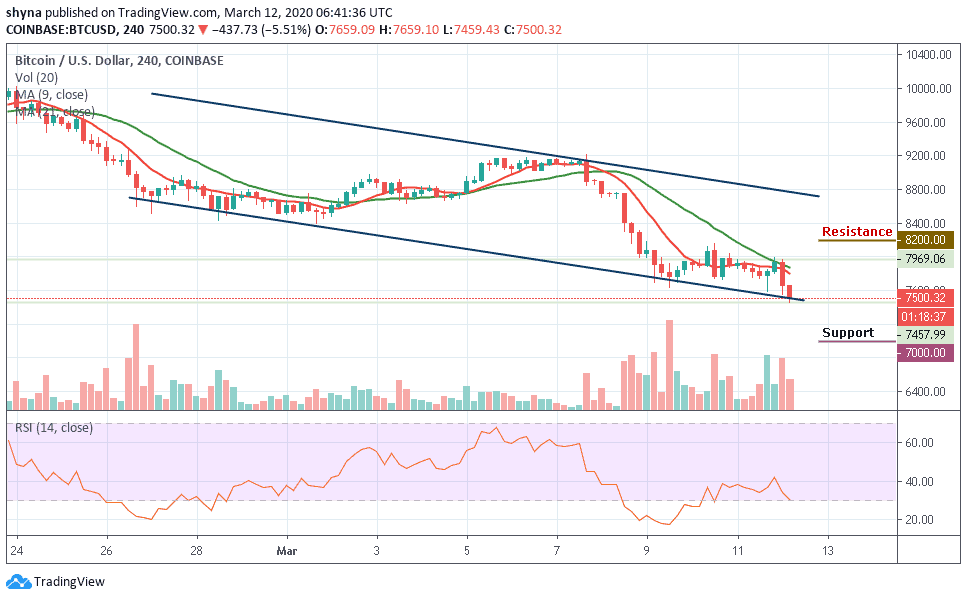
However, after gaining much momentum, the buyers are expected to regroup and power the market, traders may expect a retest at $7,800 resistance level and if the bulls can break this level, it may likely push the price towards the resistance levels of $8,200, $8,400 and $8,600. The RSI (14) is moving into the oversold zone, suggesting more bearish movement.
Please note: Insidebitcoins.com is not a financial advisor. Do your research before investing your funds in any financial asset or presented product or event. We are not responsible for your investing results.
Join Our Telegram channel to stay up to date on breaking news coverage