Join Our Telegram channel to stay up to date on breaking news coverage
Bitcoin (BTC) Price Prediction – July 18
The king coin is trading below the moving averages which indicates that the bears and the bulls have low momentum at the moment.
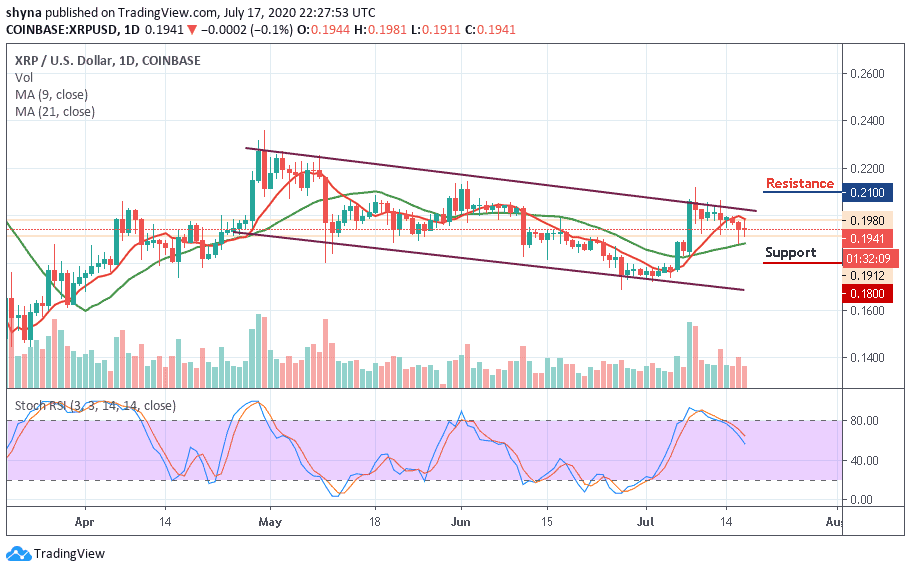
BTC/USD Long-term Trend: Ranging (Daily Chart)
Key levels:
Resistance Levels: $9,700, $9,900, $10,100
Support Levels: $8,700, $8,500, $8,300

BTC/USD is currently trading at around $165. At the opening of the market today, the Bitcoin price action is showing a strong sign of upside momentum, as it seems to reclaim back the $300 level above the 9-day and 21-day moving averages. More so, the bulls are making a good way to push to escape a bearish technical set up.
However, in case the daily bullish candle close above the moving averages, the Bitcoin price may continue its bullish trend in which the resistance levels of $9,700, $9,900, and $10,100 will be the targets. Failure to break above the moving averages within the channel, BTC/USD may continue to range around $9,100 – $9,200 levels and traders may exercise patience for clear direction before placing order.
Nevertheless, the technical indicator stochastic RSI is around 25-level with the signal lines pointing downside to indicate a sell signal. In case the bulls failed to gain traction above the moving averages, the price may likely decrease below the lower boundary of the channel to hit the critical supports at $8,700, $8,500, and $8,300 respectively.
BTC/USD Medium – Term Trend: Bearish (4H Chart)
Looking at the 4-hour chart, the bears have been dominating the market for the past few days, but the bulls are now stepping back into the market, trying to push the coin to the north. If not, the $9,050 and below may come into play if BTC breaks below the 9-day moving average.
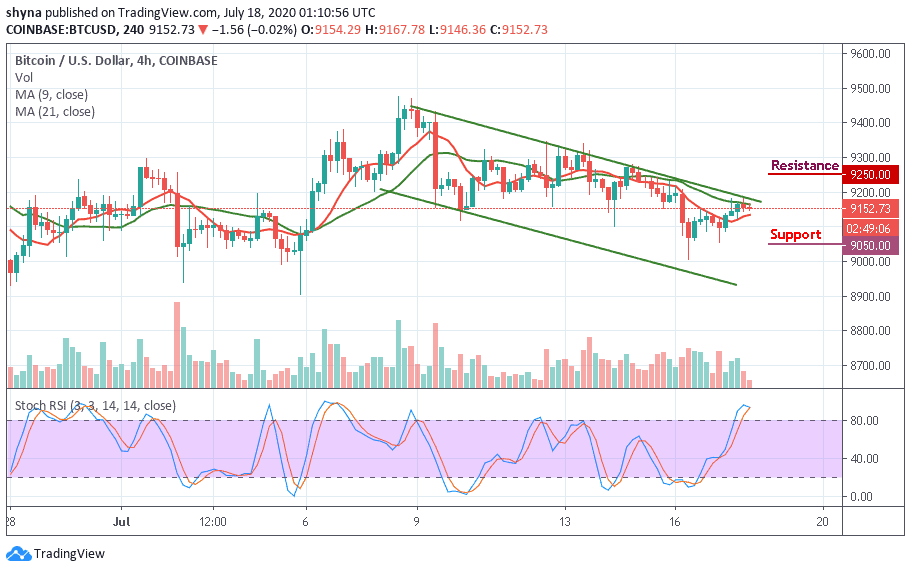
However, if the buyers can reinforce and power the market more, traders can expect a retest at $9,200 resistance level, and breaking this level may further push the price towards the resistance level of $9,250 and above. The stochastic RSI is already within the overbought zone, suggesting bullish signals.
Join Our Telegram channel to stay up to date on breaking news coverage