Join Our Telegram channel to stay up to date on breaking news coverage
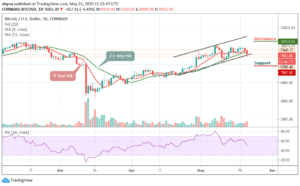
Bitcoin (BTC) Price Prediction – May 21
The Bitcoin (BTC) remains on the downside but the coin is still in the hands of the bulls that lack enough momentum to sustain gains above $9,500.
BTC/USD Long-term Trend: Bullish (Daily Chart)
Key levels:
Resistance Levels: $10,500, $10,700, $10,900
Support Levels: $7,800, $7,600, $7,400
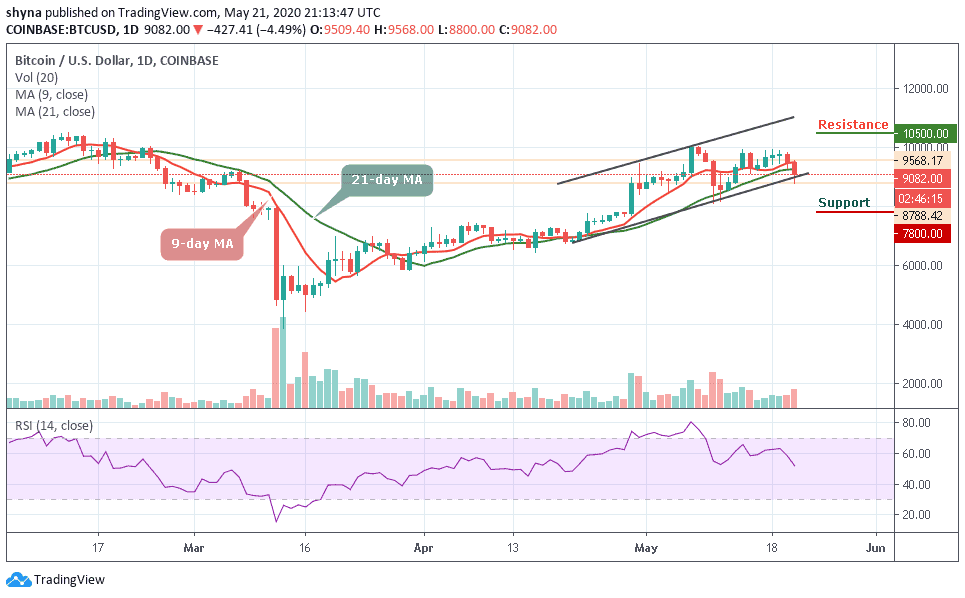
At the time of writing, BTC/USD hits the intraday low at $8,788.42 and swiftly recovered above $9,000 to trade at $9,082. The strong buying interest clusters around $9,000 cushioned the sell-off which is now pushing the coin back above the pivotal level. Nevertheless, traders may need to see a move towards $ 9,200 in the near future to avoid further decline.
For now, the RSI (14) on the daily chart focuses on the south, though there are no signs of the reversal as of yet and this means that BTC/USD may be vulnerable to further losses. However, if the price moves back below $9,000, the next support of $8,800 may come into focus while further supports lie at $7,800, $7,600, and $7,400 respectively. On the upside, a recovery above $9,400 will improve the short-term technical picture which may allow the upside moving towards the intraday high at $9,568.
At the time of writing, Bitcoin is trading at $9,082, which is a 4.49% loss from the opening value at $9,500. The Bitcoin bulls refused to give up the fight to $10,000 in spite of the stronger bearish grip and their main goal is to sustain gains above $9,500 and step above the resistance at $9,600. This way, other buyers watching from the side-lines may join the market and aid in pushing the price to $10,500, $10,700, and $10,900.
BTC/USD Medium-Term Trend: Bullish (4H Chart)
On the 4-hour chart, BTC/USD is currently in the ascending range of the medium-term outlook as the target market has support levels of $8,600, $8,400, and $8,200. But as the downtrend continues below the moving averages, the Bitcoin market is gaining momentum around the lower boundary of the channel as buyers keeping tight positions.
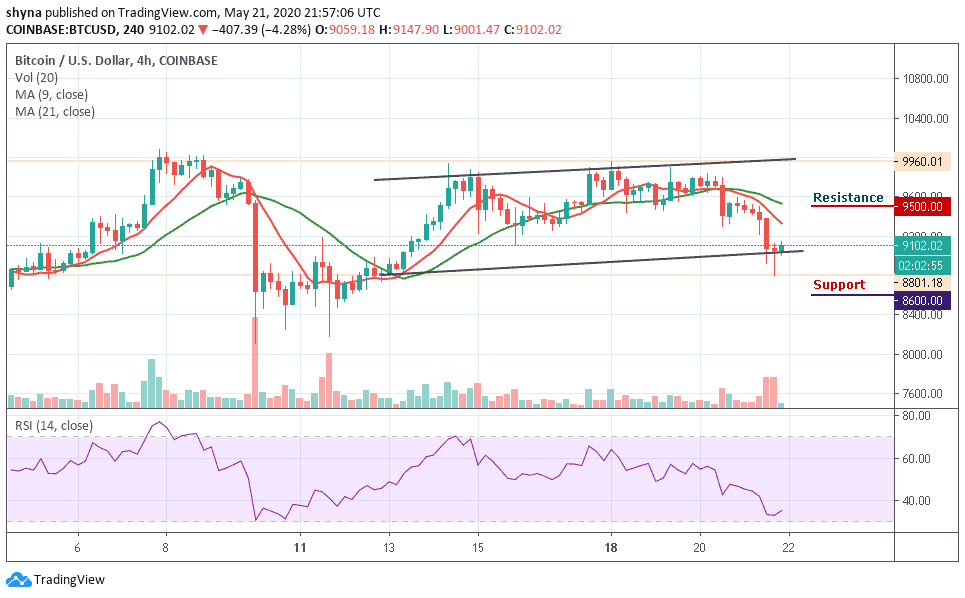
More so, the RSI (14) indicator shows that BTC price may continue to experience some slight drops for a little time before a reversal could take place. Immediately the market reverses, the buyers may likely pull the price up to reach the resistances at $9,500, $9,700, and $9,900.
Please note: Insidebitcoins.com is not a financial advisor. Do your research before investing your funds in any financial asset or presented product or event. We are not responsible for your investing results.
Join Our Telegram channel to stay up to date on breaking news coverage