Join Our Telegram channel to stay up to date on breaking news coverage
Bitcoin (BTC) Price Prediction – July 21
BTC/USD is facing the toughest barrier at $9,216 which if broken could see it approach $9,500 much faster.
BTC/USD Long-term Trend: Ranging (Daily Chart)
Key levels:
Resistance Levels: $9,650, $9,850, $10,050
Support Levels: $8,900, $8,700, $8,500

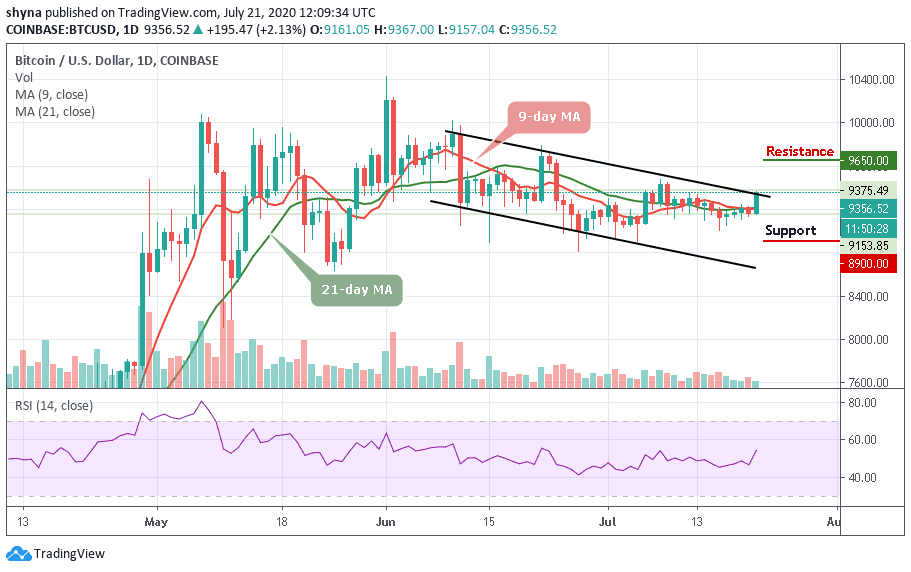
BTC/USD is dancing at $9,356 after a 1.99% growth on the day. The current trend in the market is mainly in the hands of the bulls but low volatility is keeping rapid gains at bay. In the past two days, the Bitcoin price has held its position above $9,100 support. However, movements above $9,200 have greatly been encouraged as the coin focus on the north according to the technical indicator RSI (14).
However, following a breaking above the first key resistance at $9,300, Bitcoin bulls are likely to have a smooth ride towards $9,500. However, the journey eyeing $10,050 will have to brace for more hurdles at $9,650 and $9,850. Meanwhile, in the long-run, there may be a struggle at $9,800 if the price closes below $9,500.
Looking at the downside, Bitcoin seems to be hanging in the balance with very little support. This means that bulls must work hard to pull the price above the first resistance so as to avert potential losses under the 9-day and 21-day moving averages. Meanwhile, the initial support is seen at $9,200. The remaining support areas are weak and likely to give in to selling pressure; they include $8,900, $8,700, and $8,500 support levels.
BTC/USD Medium-Term Trend: Bullish (4H Chart)
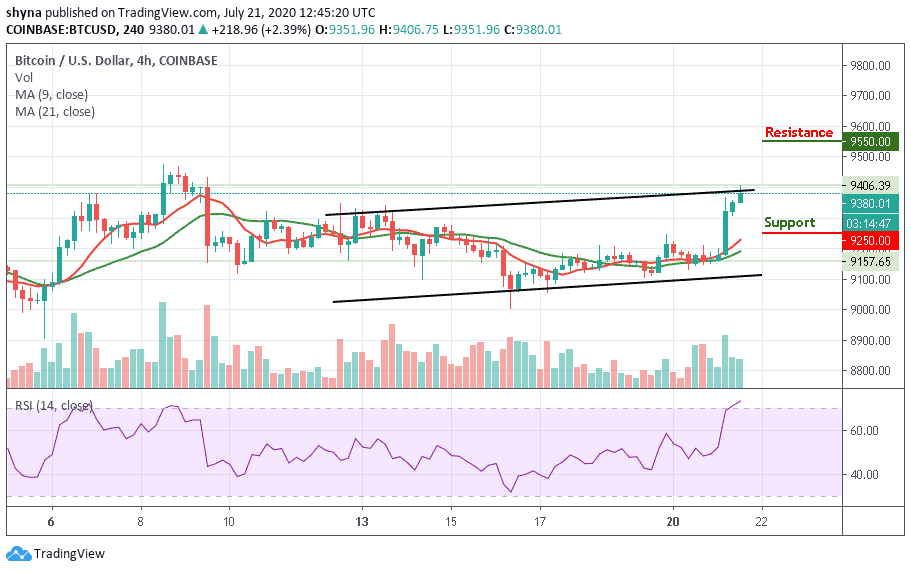
The 4-hour chart for BTC is still looking bullish as the intraday trading is looking bullish as well; following the recent rebound at $9,157.65 which is now a key support level. The next key support levels are $9,250, $9,050, and $8,850.

Moreover, considering the recent sharp rebound within the market, the Bitcoin price may re-enter the bullish rally to $9,400 resistance. Therefore, a climb above the mentioned resistance could push the BTC price to $9,550, $9,750, and $9,950 resistance levels. As it appears now, it seems the bears may likely return into the market as the RSI (14) is now revealed within the overbought zone and could resume the downward direction.
Join Our Telegram channel to stay up to date on breaking news coverage

