

Join Our Telegram channel to stay up to date on breaking news coverage
Bitcoin (BTC) Price Prediction – July 30
At the time of writing, the Bitcoin price resorts back to its stable momentum and trades at $11,171.
BTC/USD Long-term Trend: Bullish (Daily Chart)
Key levels:
Resistance Levels: $11,800, $12,000, $12,200
Support Levels: $10,300, $10,100, $9,900

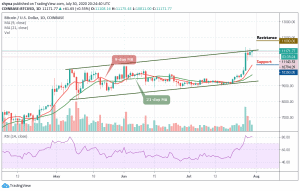
In a few consecutive days, BTC/USD shot up to about $11,300 and yesterday attempted to conquer the next resistance at $11,350 but all to no avail, as it got rejected before having a real chance to face it. At the time of writing this, BTC/USD hovers again at about $11,171. Meanwhile, should BTC successfully break above the $11,300 resistance level, it has to face a key resistance at $11,500 before touching the psychological $12,000 level.
Meanwhile, the market has remained in the consolidation mode around the upper boundary of the channel, deciding on the next move. However, it can be expected that the market may begin to sell as soon as the declines come together. If the bulls continue to show a strong commitment, the Bitcoin price could rise to the important resistance levels at $11,800, $12,000, and $12,200. The RSI (14) is at the overbought but may be coming down soon.
Looking at the daily chart, BTC/USD attempted to create more bullish trends but failed to break out of the channel limited to $11,345 on the upside. Weak upward momentum affected the Bitcoin bulls, although bears may soon push the price towards $10,800 to increase the chances of a downward scenario which may lead the price to $10,300, $10,100, and $9,900 levels in the next downward period.
BTC/USD Medium – Term Trend: Bullish (4H Chart)
Looking at the 4-hour chart, Bitcoin’s price is currently trading around $11,128 and above the 9-day and 21-day moving averages after rebounding from $10,831 low where the market price touched today. More so, the daily chart reveals that the bullish supply is coming up gradually in the market while the bears are also trying to drag the price down.
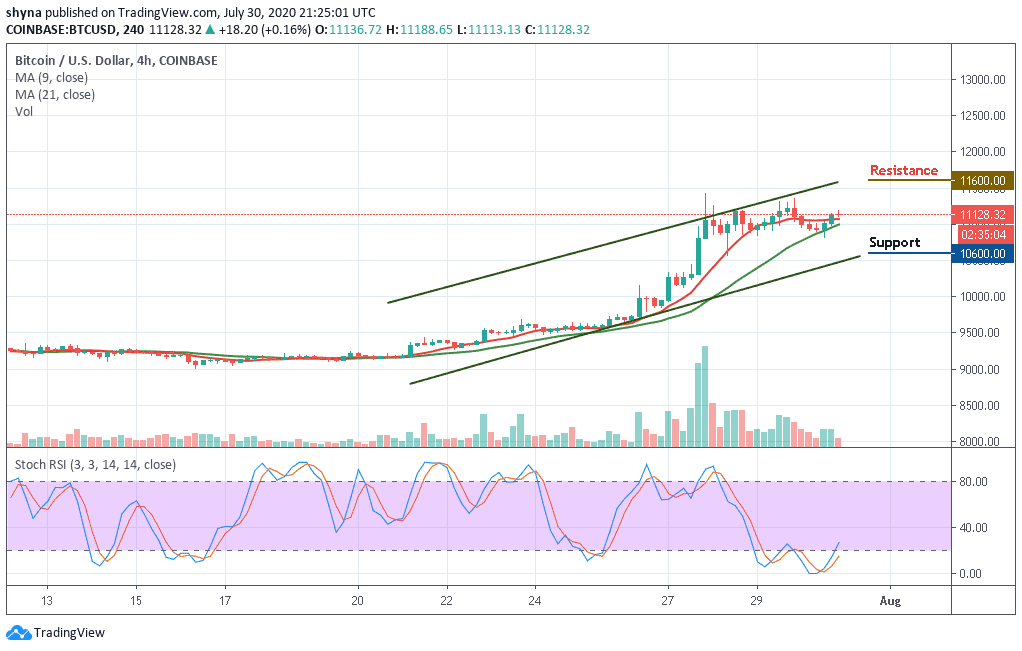
However, if the buyers can re-energizes the market, they can further push the price to the $11,400 resistance level. Therefore, breaking the mentioned resistance could also allow the bulls to test the $11,600 and above. In other words, the stochastic RSI is still within the oversold region which may allow the market price to hit the support level of $10,600 and below.
Join Our Telegram channel to stay up to date on breaking news coverage