Join Our Telegram channel to stay up to date on breaking news coverage
Bitcoin (BTC) Price Prediction – July 25
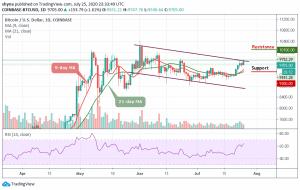
Bitcoin price is trading nicely above the $9,700 and the coin must climb above this level to continue the bullish movement.
BTC/USD Long-term Trend: Bearish (Daily Chart)
Key levels:
Resistance Levels: $10,100, $10,300, $10,500
Support Levels: $9,300, $9,100, $8,900
BTC/USD had a bullish start today as the price went up slightly from $9,551 to $9,752. In the process, the coin is still trading above the 9-day and 21-day moving averages. Over the past few days, the first digital coin has been maintaining an upward movement. Therefore, the bulls will need to cross above the upper boundary of the channel to continue and, more importantly, sustain the bullish momentum.
However, the $10,000 level is the next big resistance level the bulls may need to conquer, which could possibly trigger a significant uptrend in the nearest term. Actually, this may not be possible today because the weekend is usually an infamously slow day for the coin. Meanwhile, the coin may likely experience some consolidation before embarking on the next move.
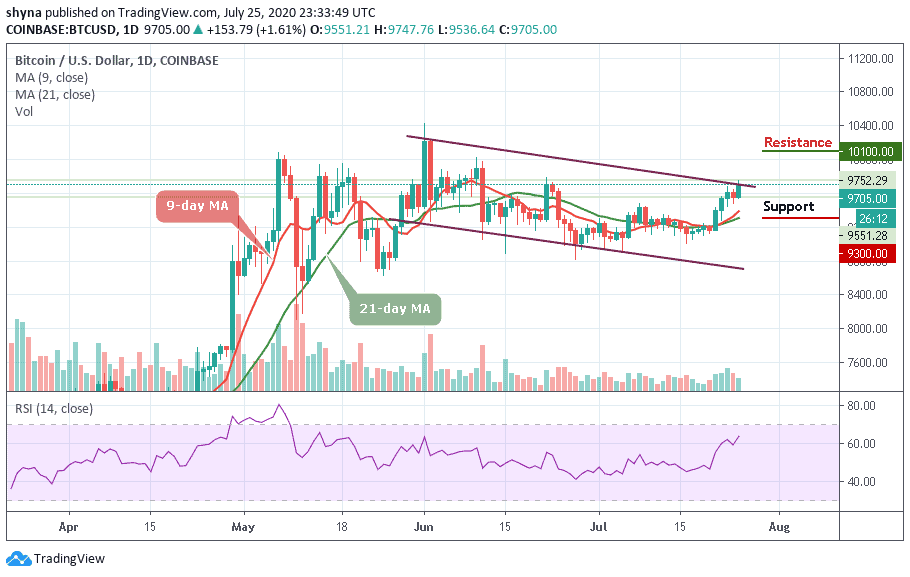
Furthermore, the market price for BTC/USD and the daily candle is trading at $9,705 and above the 9-day and 21-day moving averages. The next resistance level lies at $10,100, $10,300, and $10,500. However, if the Bitcoin price failed to extend its movement to the north; traders may experience a price cut to $9,500 vital support. A further low drive could send the price to $9,300, $9,100, and $8,900 supports.
For now, the market may likely move in sideways before forging ahead to the next direction. But with a look of things, the daily chart reveals that BTC/USD is rising as the RSI (14) indicates increasing bullish momentum.
BTC/USD Medium – Term Trend: Bullish (4H Chart)
The 4-hour chart reveals that the BTC/USD is currently trading around $9,695 near the upper boundary of the ascending channel after a rejection from $9,750 that occurred in the past few hours. However, the 4-hour chart also shows that the bulls are still dominating the market while the bears are also trying to bring the price down.
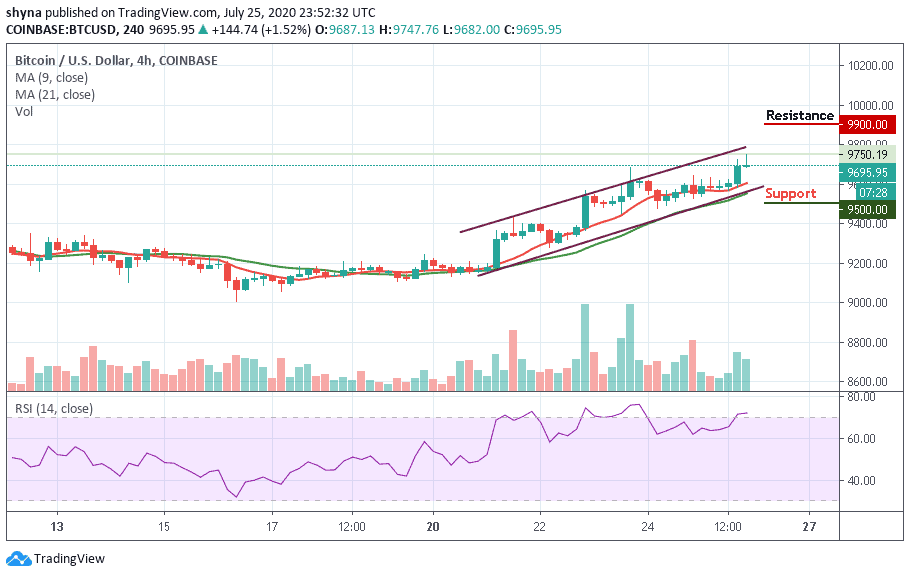
Furthermore, if the buyers could strengthen and energize the market more, they can further push the price to a $9,800 resistance level. Therefore, breaking the mentioned resistance may likely hit the resistance level of $9,900 and above. In other words, the RSI (14) is seen moving within the overbought zone, but when it turns down; the price could go below the moving averages to retest the support level of $9,500 and below.
Join Our Telegram channel to stay up to date on breaking news coverage