Join Our Telegram channel to stay up to date on breaking news coverage
Bitcoin (BTC) Price Prediction – April 30
Unexpectedly, BTC/USD pair rebounded yesterday as it broke the $8,000 resistance and repossessed $8,500 price level. As the bulls hold the $8,000 support, further upside movements are likely occur. Similarly, with the breaking of $8,400 resistance, traders can ‘buy the dip’.
Key Levels:
Resistance Levels: $10,000, $11, 000, $12,000
Support Levels: $7,000, $6,000, $5,000
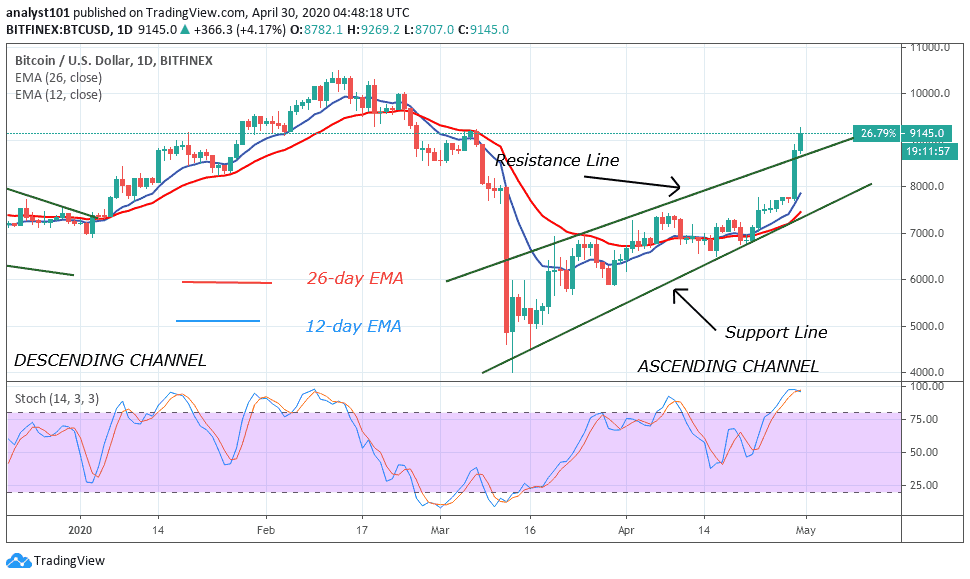
In the last one week, Bitcoin has been fluctuating above $7,500 as no particular direction of price movement was in place. With the breaking of the $8,000 support and the subsequent surge, the bulls are in control. Bitcoin will rise to $9,200 if the bulls sustain the current momentum. However, if the bulls fail to sustain the current uptrend, this will indicate that the bulls lack buying at higher levels. Presently, the bulls are contesting the $8,800 to $9,000 resistance zones. Initially, price tested $8,900 resistance but was repelled.
A repeat retest is ongoing to break the $8,900 resistance. BTC will rise above $9,000 if the bulls are successful. Meanwhile, when price breaks and closes above the resistance line of the ascending channel, the uptrend is likely to continue. This implies that the trend is ongoing. Similarly, Bitcoin has reached a 97% range of daily stochastic. This implies that the market is in the overbought region. It is also an indication that sellers may come in to push prices downward.
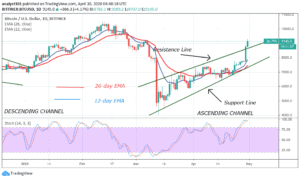
BTC/USD Medium-term Trend: Ranging (4-Hour Chart)
On the 4 hour chart, BTC has three stages of the current upsurge. On April 23, the coin was in a price spike, and then it pulled back above $7,500. The king coin consolidated above $7,500 for a week to determine the next move of the coin. Lastly, it rebounded yesterday as it broke through the $8,000 and $8,500 resistances.

The bulls have jumped over the hurdle above $9,000. Buyers are making concerted efforts as the coin is currently trading at $9,000 at the time of writing. Bitcoin has risen to level 88 of the Relative Strength Index period 14. It indicates that the market is in the overbought region. It also means that sellers may likely emerge in the overbought region.
Please note: Insidebitcoins.com is not a financial advisor. Do your research before investing your funds in any financial asset or presented product or event. We are not responsible for your investing results.
Join Our Telegram channel to stay up to date on breaking news coverage