


Join Our Telegram channel to stay up to date on breaking news coverage
Bitcoin (BTC) Price Prediction – March 1
Bitcoin (BTC) declined more than $1,500 in the past few days. The coin is now facing a drop to $8,200 or $8,000 before a strong upward move in the coming days.
BTC/USD Long-term Trend: Ranging (Daily Chart)
Key levels:
Resistance Levels: $9,600, $9,800, $10,000
Support Levels: $7,500, $7,300, $7,100
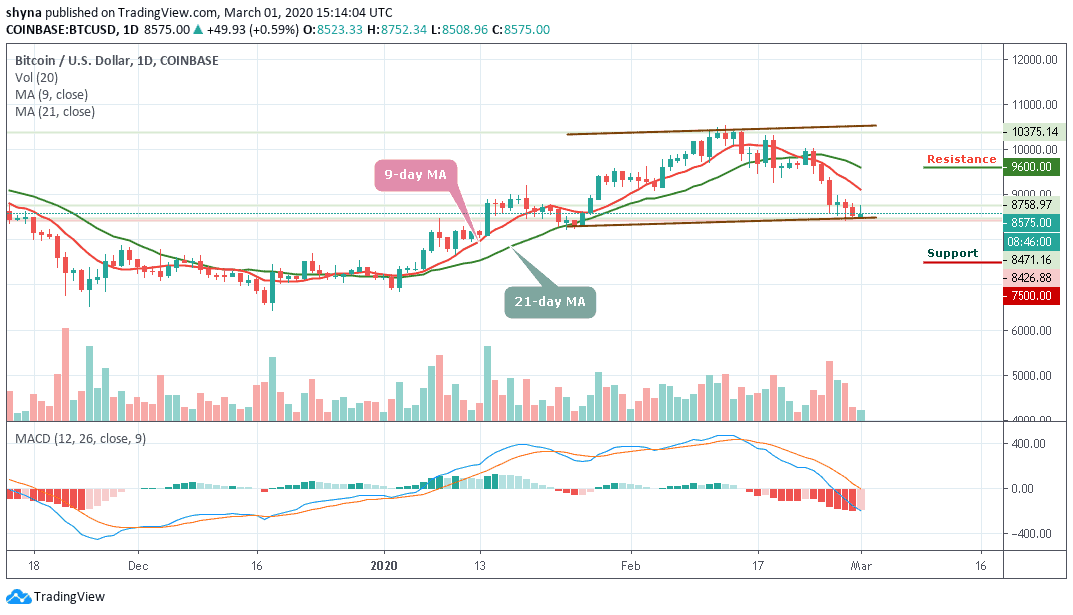
After forming a short term top, BTC/USD price dived below $9,000 and $8,800. The Bitcoin price is currently consolidating around $8,500, with a few bearish signals. However, the recent correction to the upward failed near the $8,758 level. It seems like Bitcoin bulls are struggling to gain momentum above the $8,800 level. There is also a key declining channel forming with resistance near $8,660 on the daily chart.
Moreover, on the downside, the $8,300 and $8,250 levels are initial supports. If the bulls fail to defend the recent low of $8,426, there is a risk of a sharp decline. The next key supports on the downside are near the $8,000 and $7,800 levels, where the bulls are likely to take a strong stand. But if the bulls fail to take a strong stand within this level, then, BTC/USD may drop further to the critical supports of $7,500, $7,300 and $7,000 respectively.
Nevertheless, if there is a clear break above the 9-day moving average, the Bitcoin price could test the $9,200 resistance level. If the bulls manage to gain strength above $9,200, there are chances of a decent recovery towards the $9,400 resistance area. The key breakout zone is near the $9,600, $9,800 and $10,000 resistance levels. Meanwhile, the MACD for BTC/USD is about to move into the bearish zone.
Therefore, the upsides may remain capped unless there is a solid recovery above the $9,200 and $9,300 levels.
BTC/USD Medium – Term Trend: Ranging (4H Chart)
At the opening of the market today, the Bitcoin price first went up but has dropped slightly within 24 hours, bringing its price from $8,750 to reach around $8,588. Should the price continue to drop further and move below the channel, it could reach the nearest supports at $8,300, $8,100 and $7,900.

Moreover, if the bulls push the coin above the 9-day and 21-day moving averages, the price of Bitcoin may likely reach the potential resistance levels of $8,900, $9,100 and $9,300. At the moment, the market is indecisive as the RSI (14) indicator moves below the 40-level.
Please note: Insidebitcoins.com is not a financial advisor. Do your research before investing your funds in any financial asset or presented product or event. We are not responsible for your investing results.
Join Our Telegram channel to stay up to date on breaking news coverage
