Join Our Telegram channel to stay up to date on breaking news coverage
Bitcoin (BTC) Price Prediction – March 3
Within 48 hours, the Bitcoin price is down from $8,993 to $8,701. No quick recovery seems possible for the coin at the moment.
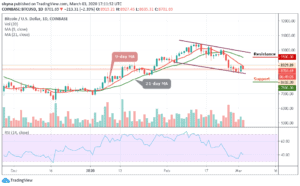
BTC/USD Long-term Trend: Bearish (Daily Chart)
Key levels:
Resistance Levels: $9,500, $9,700, $9,900
Support Levels: $7,800, $7,600, $7,400

Before now, BTC/USD seems strong-willed as the coin moved from $8,504 to $8,993 yesterday but the price is currently facing back the support level of $8,500. Instead of crossing the red-line of the 9-day moving average, the bears have ushered the coin below $8,800 today and now on its way to cross below the lower boundary of the channel. Yesterday’s bullish price moves took the coin as high as $8,993 and since then, Bitcoin has been tumbling.
Furthermore, the latest price reduction has made Bitcoin’s price to see a sharp cut of over $200, amounting to a 2.39% loss as it moves toward the south. In the time of following this rally, BTC/USD has been making an effort to erase the gains of yesterday’s trading, with the crypto plummeting to lows of $8,632 before climbing slightly to its current price of $8,701.
However, today’s price corrections have traced a falling flag which has been breached very recently. Meanwhile, looking at the daily chart, $7,800, $7,600 and $7,400 serves as the major support levels, making room for BTC/USD to fall even further. The RSI (14) for the coin has just nosedives to the 40-level. Nevertheless, BTC/USD may see resistance levels at $9,500, $9,700 and $9,600.
BTC/USD Medium – Term Trend: Ranging (4H Chart)
On the 4-hour chart, we can see that the bears have been stepping back into the market, trading below the 9-day and 21-day moving averages but the bulls are trying to defend the $8,600 support as well. Meanwhile, the $8,500 and below may be visited if BTC/USD breaks the mentioned support.
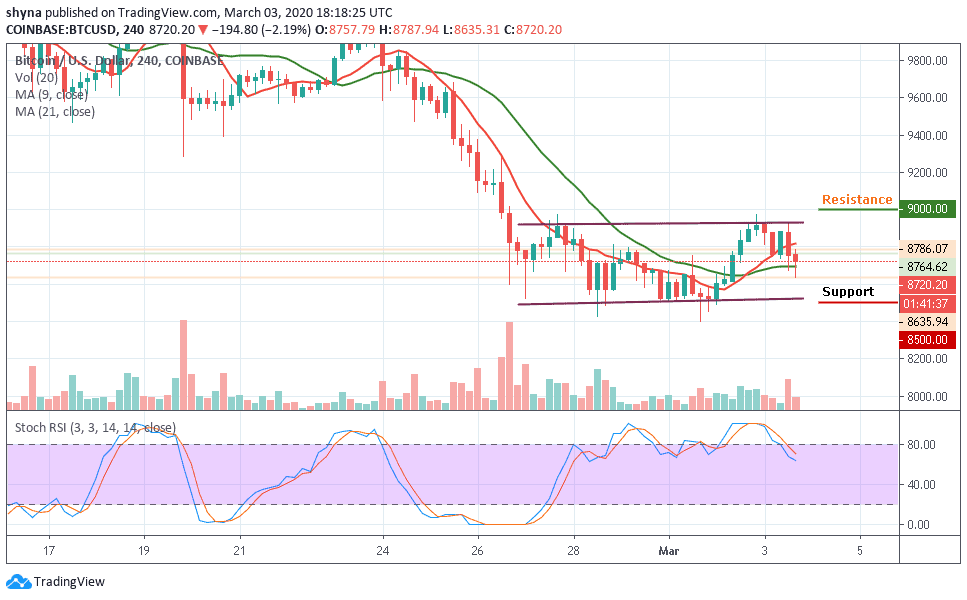
However, in as much as the buyers can push the market to the north, we may expect a retest at the $8,800 resistance level. Breaking the mentioned resistance may further allow the bulls to test the $9,000 and above on the upside but the stochastic RSI is moving out of the overbought zone indicating some bearish signals.
Please note: Insidebitcoins.com is not a financial advisor. Do your research before investing your funds in any financial asset or presented product or event. We are not responsible for your investing results.
Join Our Telegram channel to stay up to date on breaking news coverage