Join Our Telegram channel to stay up to date on breaking news coverage
Bitcoin (BTC) Price Prediction – June 26
The price of Bitcoin is trading in a downward trend for the past few days. The price of Bitcoin as of now is $9,141.05.
BTC/USD Long-term Trend: Bullish (Daily Chart)
Key levels:
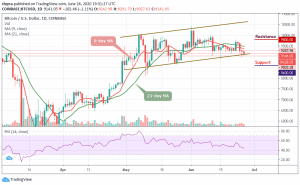
Resistance Levels: $9,800, $10,000, $10,200
Support Levels: $8,600, $8,400, $8,200

At the moment, BTC/USD is downgraded and it is trading below $9,200 around the lower boundary of the channel. The price may continue to drop towards $9,000 before it can rise again. The coin is seen trading below the 9-day and 21-day moving averages and now issuing bearish signals within four consecutive trading days on the daily chart.
However, in the recent times, Bitcoin is undergoing a prolonged downward correction below the $9,200 level of support, with the coin trading below the $9,150 level and a new weekly low at $9,033.38. The market price is now recovering from $9,033 and exceeded the resistance of $9,100. More so, the BTC/USD is trying to surpass the $9,400 level but the upward movement is limited by the resistance level of $9,300.
Moreover, as the technical indicator RSI (14) is moving below 50-level, indicating that the market price could spike below the $9,000 support level and test $8,600, $8,400, and $8,200 respectively. But once the current wave completes, the price of Bitcoin could bounce back above the moving averages and move towards the resistance levels of $9,800, $10,000, and $10,200 in the coming sessions.
BTC/USD Medium-Term Trend: Bearish (4H Chart)
Looking at the four-hour chart, Bitcoin failed in an endeavor to break above the 9-day moving average within the channel. This is plausibly why the bears are fuelled to push the price to lower levels. Meanwhile, Bitcoin is trading at $9,201.64, although it opened the session at $9,246 and this represents a 0.45% drop on the day.

However, the shrinking volatility in BTC/USD indicates that the downtrend is unlikely to extend further. Besides, $9,000 is key support and if the bulls could not defend this support level, the price may likely test the critical support level of $8,900 and below. In other words, the resistance level of $9,500 and above could be visited if there is a rebound as the technical indicator RSI (14) is seen facing the north.
Join Our Telegram channel to stay up to date on breaking news coverage