
Join Our Telegram channel to stay up to date on breaking news coverage
Bitcoin Price Prediction – September 6
The Bitcoin price prediction reveals that BTC begins a downside correction, after touching the daily high of $52,219.
BTC/USD Long-term Trend: Bullish (Daily Chart)
Key levels:
Resistance Levels: $56,000, $58,000, $60,000
Support Levels: $48,000, $46,000, $44,000
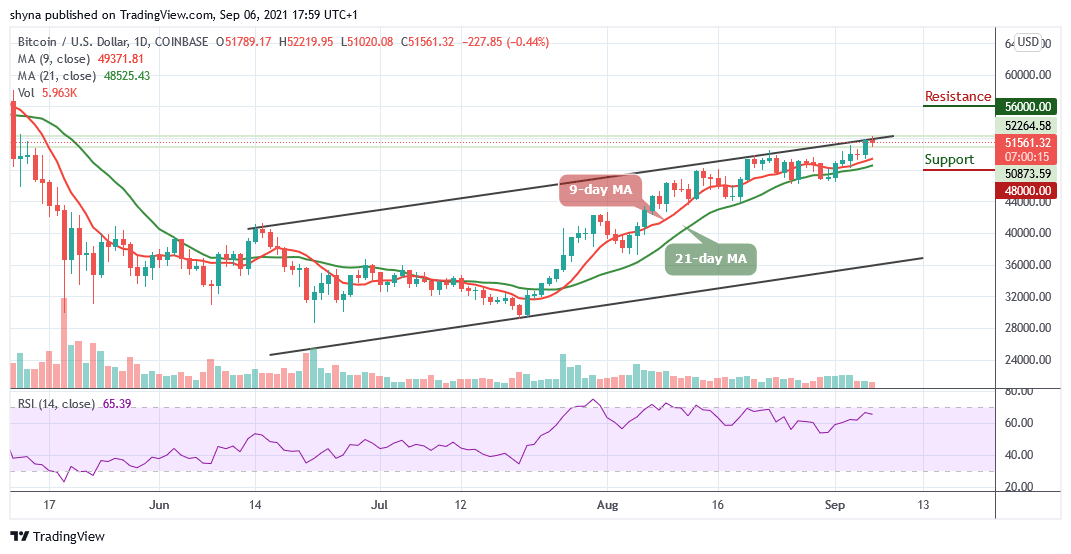
BTC/USD is seen slipping below the $52,000 level as buying pressure is currently cooling off. The market price is seen trading below $51,600 and formed a low at near $51,020 before stabilizing. At the time of writing, BTC/USD remains trading above the 9-day and 21-day moving averages but it is down by 0.44% at its price of $51,561.
Bitcoin Price Prediction: Bitcoin Price May Consolidate
The Bitcoin price is presently testing lower levels for the past few hours. A decisive breakout below $51,000 support may intensify selling pressure. However, if the coin slides below the 9-day and 21-day MAs, the movement may turn into a bear-run. Nevertheless, the market is likely to consolidate for the next few days and the next hurdle for the king coin could come at $53,000, but may not stop the higher price movements.
However, bulls need massive liquidity and volume to cross the upper boundary of the channel and make a dash to the $54,000 level. The technical indicator Relative Strength Index (14) is seen moving around 66-level as the signal line moves in the same direction. Moreover, a reversal is likely to come into play but only if the resistance level of $52,000 is reclaimed. The persistence trade above this level may technically push the coin to the resistance levels of $56,000, $58,000, and $60,000 while the supports lie at $48,000, $46,000, and $44,000.
BTC/USD Medium – Term Trend: Bullish (4H Chart)
Looking at the 4-Hour chart, Bitcoin (BTC) is still trading well above the 9-day and 21-day moving averages as the coin is still in the loop of crossing above the upper boundary of the channel. At the moment, the Bitcoin price is currently hovering around the $50,500 level.
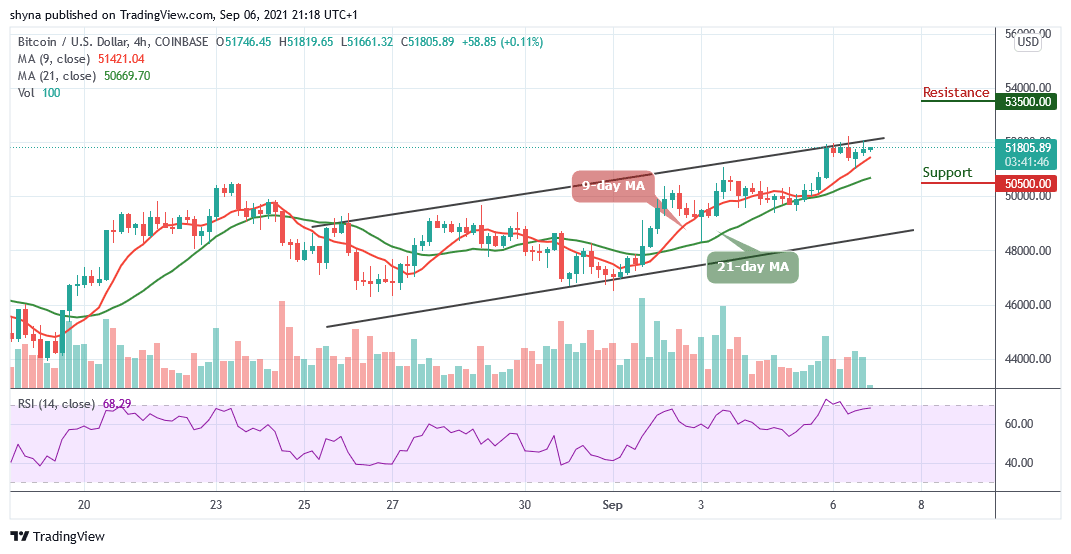
However, if bulls step back into the market, the Bitcoin price may likely hit the support level of $50,500 and below. On the other hand, if bulls should continue to hold the price and push it upward, then the resistance level of $53,500 and above may be reached as the Relative Strength index (14) aims to cross into the overbought region, indicating a possible bullish movement.
Looking to buy or trade Bitcoin (BTC) now? Invest at eToro!
75% of retail investor accounts lose money when trading CFDs with this provider
Read more:
- How to buy bitcoin
- How to buy cryptocurrency
Join Our Telegram channel to stay up to date on breaking news coverage